Wednesday, August 14, 2019

Reflections: Hit Refresh (Part 1)

Introduction

I had been meaning to read Satya Nadella's Hit Refresh for some time before joining Microsoft myself as an FTE in April 2018. One of the welcoming gifts to new hires was this book, and I decided to read it promptly. I remember being impressed by the thoughtfulness of the author and the attitude that the book advocated, and it made me all the more eager to dive into my new role.

While I had intended to write a reflection on the book closer to the time of actually reading it, life happens, and here I am over a year later. However, I have recently looked back over the book, scanning the underlined portions and notes taken in the margin and reflecting on the ideas, thoughts, and vision expressed in its pages.

The book can be divided into two parts. The first recounts and reflects on Satya's professional journey and how Microsoft has and is changing under his leadership. The second focuses on Satya's thoughts on the future of Microsoft and technology. I will take up the first part in this post, and consider the second part in a follow up post.

Note: all personal opinions expressed below are my own and do not represent any official opinions or positions taken by my employer.


Part 1: Chapters 1 - 5

Mission

Since becoming CEO, Satya has made it his job to make the company culture about people. One of the first things he did with the senior leadership team was to have them share with each other about themselves personally. For many, it was the first time they had talked about themselves, "not exclusively about business matters" (6). Work needed to become a personal and meaningful place to be, for "we spend far too much time at work for it not to have deep meaning" (6).

How could this meaning be given to work? How could this personal touch be brought to the workplace? Satya believed it could happen by connecting what people were passionate about with what Microsoft was working on, and by making people the focus of what Microsoft was doing. In short, to "employ Microsoft in pursuit of [employee's] personal passions to empower others" (11). Said in a different way, "[o]ur culture needed to be about realizing our personal passions and using Microsoft as a platform to pursue that passion" (94).

I believe Satya would say that this was what Microsoft's mission had been all along, but that mission had been obscured and perhaps forgotten at times. Since Microsoft's "soul is about empowering people" (68) it is important to make that explicit, hence, Microsoft's mission statement was more explicitly stated and promoted: to "empower every person and every organization on the planet to do more and achieve more" (79). Such a clear mission statement unambiguously gave purpose and focus to what the company was doing, and with such a noble goal as empowering others, this mission statement also gave meaning to the work being done.

Leadership: Clarity and Energy

By unambiguously stating Microsoft's mission, Satya demonstrated a key leadership principle: to
"bring clarity to those you work with" (119). Without a clear direction or goal, the company could not leverage its resources in a coherent or efficient manner. It would be reactionary, flailing about in response to markets and other companies instead of steadily and diligently driving towards fulfilling its purpose through its products and solutions.

Satya also demonstrated another leadership principle, that of generating energy (119). By defining a noble purpose for the company, Satya gave employees energy, or to use his words, passion, again. If Microsoft's mission was about empowering others, and pursuing one's passions at work was to be the means to fulfilling this mission, how could one not be excited and energized about coming to work?

Culture

While empowering others (i.e., customers) was the mission, Satya needed to create a culture at Microsoft that would support and sustain that vision and actually carry it out. A mission statement that is not lived is just mere verbiage. Any energy generated by that mission statement would fizzle out if not actually carried out. The culture needed to change in order to implement the mission.

Satya defines culture as "the values, customs, beliefs, and symbolic practices that men and women live and breathe each day. Culture is made up of acts that become habitual and accrue to something coherent and meaningful" (91). Satya made "renewing our company's culture" his "highest priority" when he became CEO (2). Why? In short, because the company culture is the foundation for everything that the company does, everything that the people in the company do, everything that the people in the company experience. It supports the vision and purpose for the company. It sets the tone and feel of the workplace and the attitudes of those working there.

In a very real sense, culture is the company.

My impression is that Microsoft had been more of a top-down decision, fear-based, and internally-competitive culture prior to Satya's new role as CEO. The company was fragmented along organizational lines, moving in different and often conflicting directions without a clear sense of coherent purpose or mission. It was all about business and performance. It was reactionary.

In the early 2000s, Microsoft was largely on the defensive against the likes of Google, Amazon, and Apple, who were disrupting the technology world and innovating with speed and passion. Microsoft had appeared to stall out, living off past successes and choosing to mimic the products and services of these other companies. There was no sense of vigorous competition. Instead, a spirit of defeat and settling had prevailed. Passions were squashed or left unconnected to one's day to day work experience. Jill Tracie Nichols, Satya's chief of staff, told him days before he became CEO that "[employees] are actually hungry to do more, but things keep getting in their way" (67). Satya needed to allow employees and Microsoft to once again become a place of passion and innovation, a place where Microsoft would not settle for business as usual and would go on the offensive against competing companies. A place with a "sense of purpose and pride in what we do" (71).   A place where Microsoft would once again "compete vigorously and with passion in the face of uncertainty and intimidation" (38).

How could this change take place? Here are some key principles that Satya focused on for bringing about the culture change.


Individual and Internal Empowerment

Although Microsoft as a company now had a clear vision for empowering others outside the company, it needed to adopt a culture of empowering employees internally. "The key to the culture change was individual empowerment" (109).

For Satya, leadership is about "bringing out the best in everyone" (40). A leader needs to "bolster the confidence of the people [he or she is] leading" (40). A leader's job is to empower those who follow the leader, but not so much with skills or learning. Instead, the leader provides the inspiring vision and encourages the formation of proper attitudes. But the vision and attitudes must be made one's own if they are to be effective. Quoting Ray Ozzie, Satya agrees that "[t]he one irrefutable truth is that in any large organization, any transformation that is to 'stick' must come from within" (53). Similarly, any transformation of the culture at Microsoft would have to "come from within, from the core. It's the only way to make change sustainable" (57).

We know that this is true for individuals too. External pressures to do things never really work until they are internalized. The motivation has to come from within. The ownership and responsibility has to be with the individual. Otherwise a fear based, micro-managerial, and bureaucratic culture will ultimately prevail. Microsoft's previous culture of top-down and fear based decision making had to be replaced with bottom-up empowerment and freedom.

Servant Leadership and Collaboration

Another major part of the culture change required the use of another leadership principle: "the importance of putting your team first, ahead of your personal statistics and recognition" (39). A company at odds internally with itself, where employees were rewarded based on outcompeting coworkers, could not effectively compete with outside companies. A house divided cannot stand. The success of the company depended on its many parts working together, which required changing the culture to one where employees, teams, and organizations were required to build on the successes of others and to help others succeed. Collaboration towards shared success would be rewarded over "winning" at the expense of others (and ultimately the company).

In fact, Microsoft would make collaboration an intentional business strategy. By "actively seek[ing] diversity and inclusion... our ideas will be better, our products will be better, and our customers will be better served" (101-102). The inclusion of diverse perspectives and the promotion of collaboration would drive better product development as well as better employee work experiences. In short, Satya believed that "we must learn to build on the ideas of others and collaborate across boundaries to bring the best of Microsoft to our customer as one - one Microsoft" (102).

Growth Mindset

A final major attitudinal shift was the promotion of the "growth mindset". Using the principles drawn from Carol Dweck's research in her book Mindset, Satya encouraged a "learn-it-all" culture over a "know-it-all" culture. The fixed mindset assumes that one cannot grow, learn, or change to any significant degree. Decisions coming from this mindset "are ones that reinforce the tendency to continue doing what we've always done" (105). This is often done out of a fear of failure for trying something new or different. Instead, one sticks with what is known to sort-of work.

On the contrary, a growth mindset assumes that one can always learn, grow, change. As Satya applied it to Microsoft, "[w]e need to be willing to lean into uncertainty, to take risks, and to move quickly when we make mistakes, recognizing failure happens along the way to mastery" (111). For the individual, "I must internalize for myself the belief that the sky is the limit. I must work hard - not to climb the ladder, but to do important work" (116).

This mindset can only be adopted in a supportive work environment that embraces failure as a necessary byproduct of experimentation in seeking new and better ways of doing work and in creating new products. With the explicit adoption and promotion of this attitude across the company, leaders and employees could "find a way to deliver success, to make things happen," by trying new things without fear of repercussions when failure would sometimes occur (120). Microsoft would experiment and learn from its mistakes instead of trying to be perfect from the outset (and potentially punishing those that initially failed).

Conclusion

This in summary is how Satya changed Microsoft from a languishing and reactive old-school tech company to a vibrant, innovative, leading, and now cutting edge tech company once again. In short:
  • He made the company mission and purpose to be employee and customer centric.
  • He stated and promoted this mission with clarity and gave employees a purpose that they could be excited about.
  • He encouraged, promoted, and rewarded a company culture that would center around individual employee passion and empowerment, servant leadership and collaboration at all levels, and a growth mindset to encourage innovation and experimentation.
In all of this I believe Satya's approach has been correct. I have witnessed first hand the changes at Microsoft since beginning my career here as a contractor in 2012. Where this vision and culture refresh is embraced, employees seem to be happier and are thriving professionally. I have also experienced the culture at other companies, and even pockets of Microsoft where this vision has not fully permeated. In those places, cynicism, attitudes of futility and negativity, unhealthy competition, and political infighting often abound to the detriment of all involved. However, Microsoft as a whole is doing much better than it has in recent previous years in financial terms and market share. Thus, it seems that this approach has proven to be effective.

Consequently, Satya and his fellow leadership members have provided a blueprint for anyone who wants to change the culture of his or her organization or business, and it appears to be rather straightforward: focus on and serve people (employees and customers). How this is done specifically will differ from organization to organization, but if this is truly the goal that is sought after, I think any organization will make great strides in refreshing itself.

So concludes my thoughts on the first part of this book. Look for a follow up post covering the second half of this book as Satya focuses his attention on the future of technology and its impact on society.

Reference

NADELLA, SATYA. HIT REFRESH: the Quest to Rediscover Microsoft's Soul and Imagine a Better Future for Everyone. HARPERBUSINESS, 2017.

Thursday, July 18, 2019

Hope When Death Surrounds

I didn't grow up with death.

My dad's father passed away when I was relatively young, but I did not know him very well. Nobody else I was remotely close to died or even suffered from a major illness.  However, in the past two years, death has been a regularly repeated refrain.  My grandmother passed away late in 2017 after a stroke.  In the summer of 2018, a beloved uncle passed away suddenly, likely from a heart attack caused by a biologically pre-determined bad heart.  Earlier this year, a best friend of my wife lost her battle with cancer after a life of fighting with cystic fibrosis.  A month later, my mom's dad, a man who hiked mountains and scoured beaches well into his old age, passed away; he could hardly move in his final days.  We recently learned that the mom of another best friend of my wife, a woman we both know, was diagnosed with stage four cancer and given 3 months to live.

I meet with a group of men regularly throughout the year.  These men are mostly older and retired.  The concerns and struggles they share increasingly involve illness and death of loved ones.  A few I have known have also passed away.  I have reached the age when many of the people I know and love are increasingly facing illness and death.  The adults I have looked up to and continue to seek guidance from are closer to the end than the beginning, and it is starting to show.

For all the wonders that humankind has created, for all the achievements and improvements in quality and length of life we have achieved, we still have not conquered death and ultimate bodily degradation.  It is the irresolute fact that threatens to destroy and erase any meaning we find or have created here.  And if nothing lasts, if everything we have done in our lives will someday be forgotten, if everything the human race has accomplished will ultimately be wiped away through environmental destruction, the expansion and death of the sun, or the heat death of the universe, what was the point?

Some Philosophy

It seems that for something to have ultimate meaning, it has to last, be permanent, and endure. Forever.

If that is true, then we are faced with two possibilities.
  • The first possibility: nothing ultimately has meaning or matters, because there is no life after death.  Nothing endures or is permanent.  What we do in this life will be forgotten or destroyed. Life has no ultimate meaning.  We have no ultimate meaning.  
  • The second possibility: something ultimately has meaning.  Something will survive.  If that something includes us, then we have ultimate meaning too.
I would bet that most people feel that there is meaning and purpose to life in general and to their life specifically.  We may not know how to express it or account for it, but we know it and feel it.  We do ultimately matter.  Our lives ultimately matter.  What we do matters and is meaningful in some ultimate and enduring way.  If so, by a simple modus ponens, then we have to last, endure, be permanent.

Some Theology

Such an argument can be used to argue for an afterlife of some sort.  But of what sort?  Most people, if they believe in an afterlife, might imagine being up in "heaven" in a sort of disembodied immaterial state.  But if this is what actually happens in a permanent way, then notice what this implies about our bodies: if our bodies have ultimate meaning, then they will last; they do not last; therefore, they do not have ultimate meaning.  A similar argument could be made for all of material existence.

This sort of soul escapism has similarities to Gnosticism or Manichaeism, in which the material world and our bodies are something to escape.  And wouldn't it follow that, since we are escaping our bodies and this world, which will not last, we can use our bodies or this world in any manner we choose?  There might be some restrictions insofar as this impacts what will last (our souls), but any respect for bodies or the material world would derive from this relationship and not in virtue of what our bodies or this world are for their own sake, that is, in virtue of their own intrinsic value.  And wouldn't it follow that there is a lack of ultimate meaning for our bodies except in a derivative sense?  What then should we make of our bodily sufferings or the environmental destruction and material chaos that surrounds us?  Doesn't that matter, have importance, for its own sake?

On the contrary, our bodies do matter.  What happens to our bodies, our world, matters.  We don't just need salvation for our souls.  Our bodies, indeed, the whole world, needs and requires redemption and renewal.

This is what the Christian tradition advocates.  Not an escape from our bodies or material reality, but a redemption of them.  Not that the material reality will ultimately be destroyed, but that it will be renewed and endure.  The Apostle's Creed proclaims a belief in "the resurrection of the body" and the "life everlasting".  The Nicene Creed states that "we look forward to the resurrection of the dead and the life of the world to come."  The Christian belief professes that after death, souls will be reunited with healed, restored, and redeemed bodies (see here),  and the material world itself will be freed from corruption and renewed (see here).   Our bodies, and all of created reality, will endure forever, having been healed and restored from all material degradation and decay.

Death will not have the final word.

A Hope

What if spring never came?  What if after the flowers bloomed in summer and the trees dazzled us with their many colors in the fall, they would slowly die or be reduced to skeletons of bark and wood alone, never to return to fullness of life?  We might remember what once was, but what did it matter if that was the end?  However, we know that spring will come, and new life will shoot up from the ground in a burst of sights and smells.  The earth will be fresh, healthy, and alive once more.

The resurrection of the body is the hope for spring.  It is the hope that a winter of death is not the end, but a never ending spring of new and restored life will come.  It is the hope that my wife's friend will breathe fully and freely for the first time. It is the hope that my mom's dad  will have the youthful and outdoor vigor I remember him for.  It is the hope that I may carve another bowl from wood by my uncle's side.  It is the hope that all will ultimately follow in the footsteps of He who did in fact conquer death.

“Where, O death, is your victory?
Where, O death, is your sting?”

(1 Corinthians 15:55)

Monday, January 7, 2019

The Seinfeld Network

The work below was created in fulfilling the final project requirements for CUNY DATA 620 Web Analytics in July 2018.  As a member of a group consisting of Walt Wells, Nathan Cooper, and myself, I was responsible for the social network analysis portion of the project.

While the final version of the project is located here (https://github.com/wwells/CUNY_DATA_620_GROUP), I have copied the relevant portions for the below to my own GitHub repository here (https://github.com/anrcarson/CUNY-MSDA/tree/master/DATA620/DATA_620_Group_Final) for long term stability.

The goal of the project was to use NLP and social network analysis methods to find interesting patterns and relationships within the scripts of Seinfeld episodes and the associated metadata.  My portion of the project focused on social network analysis of the cast, characters, directors, and writers in the show.

The code for my part is located here (https://github.com/anrcarson/CUNY-MSDA/blob/master/DATA620/DATA_620_Group_Final/Seinfeld_SNA.ipynb).  As the ipynb files are having trouble rendering in GitHub, I have copied and pasted the interesting portions below.  See the code files for complete details and code used.  Videos giving an overview of the project are also located in the main GitHub folder for the final project.

--------------------------------------------------------------------------------------------------------------

What does Seinfeld look like when analyzed using social networks? What are the relationships between cast, characters, directors, and writers like? How do these change over the seasons? This will be explored below.

Analysis Summary

  1. SNA of Actors / Characters by Season
  2. SNA of Character by Scene Number (scenes together)
  3. SNA of Directors by Season
  4. SNA of Writers by Season
  5. SNA of writers, directors, and cast

Read In Data


Pull in pre-processed and cleaned data from GitHub. There is data about the:
  • actor/character and season/episode (SEID)
  • dialogue by Character, SEID, and scene, and a subset of this data to exclude one-offs
  • director and SEID
  • writers and SEID

We will use this data for our analysis.

Data sets:

Cast:


Dialogue:


Metadata:


Writers:


1. Actor / Character and Season


We start with the actor/character and season.

For those unfamiliar with the show, Seinfeld is a "show about nothing" revolving around Jerry Seinfeld, George Costanza, Elaine Benes, and (Cosmo) Kramer. Each show usually focuses on a particular daily life annoyance that we all experience but rarely talk about (e.g., waiting for a reservation). Other important characters are Newman (Kramer's friend and a sort of nemesis to Jerry), Susan Biddle Ross (George's wife), Estelle and Frank Costanza (George's parents) , J Peterman (Elaine's eccentric boss), Morty and Helen Seinfeld (Jerry's parents), and Uncle Leo (Jerry's uncle).

Many guests come and go. According to the below grouped count, there were 1280 total Actor/Characters on the show.


A graph on characters and season produces a large graph that appears to have some structure, but cannot be discerned in its current form. We break it apart for more insight.


Projected Graph: Actor to Season


First, let's project the actor using the season value

We see that George, Jerry, Elaine, and Kramer are central to the network, as we would expect. Other important characters are Newman, Jerry's parents and Jerry's Uncle Leo, and George's parents.

Number of Nodes:
1158

Number of Edges:
120325

Degree:
[('Jason Alexander', 1157), ('Jerry Seinfeld', 1157), ('Julia Louis-Dreyfus', 1157), ('Michael Richards', 1157), ('Wayne Knight', 1092), ('Liz Sheridan', 1055), ('Len Lesser', 1035), ('Barney Martin', 985), ('Estelle Harris', 985), ('Jerry Stiller', 985)]

Closeness:
[('Jason Alexander', 1.0), ('Jerry Seinfeld', 1.0), ('Julia Louis-Dreyfus', 1.0), ('Michael Richards', 1.0), ('Wayne Knight', 0.9468085106382979), ('Liz Sheridan', 0.9189833200953137), ('Len Lesser', 0.9046129788897577), ('Barney Martin', 0.8705793829947329), ('Estelle Harris', 0.8705793829947329), ('Jerry Stiller', 0.8705793829947329)]

Betweenness:
[('Jason Alexander', 0.056323838548247226), ('Jerry Seinfeld', 0.056323838548247226), ('Julia Louis-Dreyfus', 0.056323838548247226), ('Michael Richards', 0.056323838548247226), ('Wayne Knight', 0.04254707389386355), ('Liz Sheridan', 0.040616403262133595), ('Len Lesser', 0.035426396987549555), ('Barney Martin', 0.027383543036812213), ('Estelle Harris', 0.027383543036812213), ('Jerry Stiller', 0.027383543036812213)]

Eigenvector:
[('Jason Alexander', 0.10680557493057559), ('Michael Richards', 0.10680557493057559), ('Jerry Seinfeld', 0.10680557493057558), ('Julia Louis-Dreyfus', 0.10680557493057558), ('Wayne Knight', 0.10586072702106807), ('Liz Sheridan', 0.10382121280099006), ('Len Lesser', 0.10359967554620415), ('Barney Martin', 0.10269970147289105), ('Estelle Harris', 0.10269970147289105), ('Jerry Stiller', 0.10269970147289105)]

Pagerank:
[('Jerry Seinfeld', 0.0051714699469767225), ('Jason Alexander', 0.005171469946976721), ('Julia Louis-Dreyfus', 0.005171469946976721), ('Michael Richards', 0.005171469946976721), ('Liz Sheridan', 0.004600957307622559), ('Wayne Knight', 0.004544137955759714), ('Len Lesser', 0.00435177108591984), ('Barney Martin', 0.003973489068235779), ('Estelle Harris', 0.003973489068235779), ('Jerry Stiller', 0.003973489068235779)]


Projected Graph: Season

There were 9 total seasons. Based on the actors, there is a strong relationship between seasons 6, 7, 8, and 9, and to a lesser extent, 5. Other seasons are more disconnected, particularly season 1, which has relatively weak links to the other seasons.

Number of Nodes:
9

Number of Edges:
36

Degree:
[('S01', 8), ('S02', 8), ('S03', 8), ('S04', 8), ('S05', 8), ('S06', 8), ('S07', 8), ('S08', 8), ('S09', 8)]

Closeness:
[('S01', 1.0), ('S02', 1.0), ('S03', 1.0), ('S04', 1.0), ('S05', 1.0), ('S06', 1.0), ('S07', 1.0), ('S08', 1.0), ('S09', 1.0)]

Betweenness:
[('S01', 0.0), ('S02', 0.0), ('S03', 0.0), ('S04', 0.0), ('S05', 0.0), ('S06', 0.0), ('S07', 0.0), ('S08', 0.0), ('S09', 0.0)]

Eigenvector:
[('S01', 0.33333333333333337), ('S02', 0.33333333333333337), ('S03', 0.33333333333333337), ('S04', 0.33333333333333337), ('S05', 0.33333333333333337), ('S06', 0.33333333333333337), ('S07', 0.33333333333333337), ('S08', 0.33333333333333337), ('S09', 0.33333333333333337)]

Pagerank:
[('S08', 0.1434942043226922), ('S07', 0.1318409095299596), ('S06', 0.13082253911668065), ('S09', 0.13079574454678747), ('S05', 0.12284040304997577), ('S04', 0.1159864868159047), ('S03', 0.08670297886058641), ('S02', 0.07946020473082635), ('S01', 0.05805652902658701)]


Island Method

Let's pair down each of the projected graphs using the island method to get a better look.

An edge weight greater than 1 takes the character network down from 1158 nodes to 123. As the weights increase, we see the central characters are in fact central to the network.


In the end, we are left with the four main characters.

Now let's look at season.

The seasons are reduced from 9 to 8, 6, 5, and 3. As observed above, seasons 6, 7, 8, and 9 are strongly related and are at the center of the network.


2. Character by Scene Number

Now let's look at the relationship among characters by the scenes they share together.

We see below that there are some character/scenes that are not connected to anything else. These are probably passing or transitional scenes.

As this graph is hard to see in detail, let's allow for more detailed exploration.


Below one can explore any scene from any episode and any season and look at the network based on characters in that scene. As scenes can be very short, this is done at the episode level as well.

As an example of detailed exploration, below are networks of a scene from the finale and the finale as a whole using functions that were defined previously.


Projected Graph: Character to Scene

As the above full graph is difficult to interpret in whole, let's project using character. Below we see that (as we expect), Jery, George, Elaine, and Kramer are central. Newman is also central as Jerry's parents, George's wife, and George's dad. Also central are "woman" and "man", probably passing characters that do not refer to the same woman or man, but these types of characters occur enough and are grouped together to show up here.

Number of Nodes:
1247

Number of Edges:
5493

Degree:
[('JERRY', 790), ('GEORGE', 693), ('ELAINE', 655), ('KRAMER', 607), ('JERRY ', 91), ('NEWMAN', 84), ('WOMAN', 84), ('MAN', 79), ('MORTY', 74), ('SUSAN', 74)]

Closeness:
[('JERRY', 0.7200000786831586), ('GEORGE', 0.6788215646510195), ('ELAINE', 0.6638644793282006), ('KRAMER', 0.6459813790054507), ('JERRY ', 0.4995918913311714), ('NEWMAN', 0.4989554685396666), ('WOMAN', 0.4981094228109007), ('MORTY', 0.49684572025831497), ('GEORGE ', 0.495797522536251), ('FRANK', 0.49517072415124946)]

Betweenness:
[('JERRY', 0.29695338734359367), ('GEORGE', 0.2792132762253886), ('ELAINE', 0.22483592424865878), ('KRAMER', 0.20049918848202178), ('NEWMAN', 0.006965499433055013), ('MORTY', 0.006542993944841277), ('JERRY ', 0.0061408950101195054), ('MAN', 0.005991448766686579), ('ELAINE ', 0.005034094293925), ('GEORGE ', 0.00468205121023861)]

Eigenvector:
[('JERRY', 0.38101457433569225), ('GEORGE', 0.3321655169514927), ('ELAINE', 0.3277372511815577), ('KRAMER', 0.30690595882902166), ('WOMAN', 0.07859139462881744), ('JERRY ', 0.07664033194405434), ('NEWMAN', 0.07163994655449737), ('SUSAN', 0.06969880915701644), ('MAN', 0.06793238704933884), ('FRANK', 0.06635536477257721)]

Pagerank:
[('JERRY', 0.13246755420994547), ('GEORGE', 0.10847747475931253), ('ELAINE', 0.09705337367531358), ('KRAMER', 0.09126011465460084), ('NEWMAN', 0.009791730631230662), ('JERRY ', 0.008522064914054085), ('MORTY', 0.008373384814056277), ('HELEN', 0.007102991327363675), ('FRANK', 0.006777786438202993), ('ELAINE ', 0.006632817748910791)]


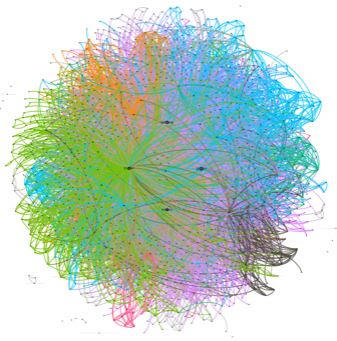
Here is the above graph visualized in Gephi. The cenral four nodes are (no surprise) Jerry, George, Elaine, and Kramer.


Island

Let's use the island method to reduce the noise. The first thresholding reduces from 1247 nodes to 551, and the second reduces that to 4 (our four main chracters). Clearly, there are lots of characters in the show, but they are mostly fleeting, passing, and revolve around a relationship to Jerry, George, Elaine, and Kramer. The strongest relationship is between Jerry and George.


3. Directors and Season

How do the directors and seasons relate?

We see two distinct groups. The first is a larger group around seasons 1-5. The second group is much smaller around seasons 6-9. While there were 5 directors in the first five seasons, there were only two different directors in 6-9. This helps explain why 6-9 are grouped much more closely together in the actor/character to season analysis. This is made even more obvious in the below projected graphs.


Number of Nodes:
7

Number of Edges:
8

Degree:
[('Tom Cherones', 4), ('David Steinberg', 3), ('Jason Alexander', 3), ('Joshua White', 3), ('Andy Ackerman', 1), ('Art Wolff', 1), ('David Owen Trainor', 1)]

Closeness:
[('Tom Cherones', 0.6666666666666666), ('David Steinberg', 0.5333333333333333), ('Jason Alexander', 0.5333333333333333), ('Joshua White', 0.5333333333333333), ('Art Wolff', 0.38095238095238093), ('Andy Ackerman', 0.16666666666666666), ('David Owen Trainor', 0.16666666666666666)]

Betweenness:
[('Tom Cherones', 0.2), ('Andy Ackerman', 0.0), ('Art Wolff', 0.0), ('David Owen Trainor', 0.0), ('David Steinberg', 0.0), ('Jason Alexander', 0.0), ('Joshua White', 0.0)]

Eigenvector:
[('Tom Cherones', 0.5235630239710829), ('David Steinberg', 0.48204443864828317), ('Jason Alexander', 0.48204443864828317), ('Joshua White', 0.48204443864828317), ('Art Wolff', 0.1696503387049744), ('Andy Ackerman', 2.4826834530544244e-06), ('David Owen Trainor', 2.4826834530544244e-06)]

Pagerank:
[('Tom Cherones', 0.20289637934863064), ('David Steinberg', 0.14894828459348708), ('Jason Alexander', 0.14894828459348708), ('Joshua White', 0.14894828459348708), ('Andy Ackerman', 0.14285714285714285), ('David Owen Trainor', 0.14285714285714285), ('Art Wolff', 0.0645444811566223)]


Number of Nodes:
9

Number of Edges:
16

Degree:
[(1, 4), (2, 4), (3, 4), (4, 4), (5, 4), (6, 3), (7, 3), (8, 3), (9, 3)]

Closeness:
[(1, 0.5), (2, 0.5), (3, 0.5), (4, 0.5), (5, 0.5), (6, 0.375), (7, 0.375), (8, 0.375), (9, 0.375)]

Betweenness:
[(1, 0.0), (2, 0.0), (3, 0.0), (4, 0.0), (5, 0.0), (6, 0.0), (7, 0.0), (8, 0.0), (9, 0.0)]

Eigenvector:
[(1, 0.4472135954430211), (2, 0.4472135954430211), (3, 0.4472135954430211), (4, 0.4472135954430211), (5, 0.4472135954430211), (6, 7.978557153034853e-06), (7, 7.978557153034853e-06), (8, 7.978557153034853e-06), (9, 7.978557153034853e-06)]

Pagerank:
[(6, 0.12489850979595186), (8, 0.12489850979595185), (1, 0.1111111111111111), (2, 0.1111111111111111), (3, 0.1111111111111111), (4, 0.1111111111111111), (5, 0.1111111111111111), (7, 0.09732371242627035), (9, 0.09732371242627033)]


4. Writers and Season

What about writers and season?

Unlike the directors, the writers/season graph form one cluster, and there are many more writers than directors.


The four main writers are: Larry David (who originated the show with Jerry), Jerry Seinfeld, Peter Mehlman, and Andy Robin. Peter Mehlman and Larry David are the most central writers in the network.


Looking at writers to season, we again see that seasons 6-9 form a strong link based on writers. As we would expect the writers to have large control over which characters/actors show up, it shouldn't surprise us that having the same writers in 6-9 tends towards having the same characters in 6-9.


5. Writers, Directors, and Cast


Finally, let's look at the relationship between writers, directors, and cast directly using the SEID to join.

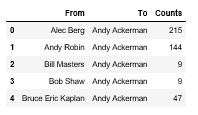
While the first graph below is a little difficult to read, by increasing the counts threshold, we can see that the strongest director-writer relationship exists between Tom Cherones and Larry David. This is interesting as Tom Cherones only directed in seasons 1-5. However, Andy Ackerman (6-9) has a strong relationship with several writers, including Larry David.


Now let's look at writer and cast. The first few graphs produce an un-interpretable mess.


After increasing the counts threshold, we can see some insights coming out of the noise. In particular, we see that the main writer (Larry David), along with Peter Mehlman and Larry Charles, are strongly related to the four main characters. Again, this is not surprising as the main writers should be related to the main characters.


Now we look at the relationship between director and cast.


We see that central directors Tom Cherones and Andy Ackerman are connected to the four main characters strongly. Other important characters J Peterman, Newman, Susan, Jerry's parents, and George's parents. Again, not surprising.


These relationships are made more obvious by using projections.

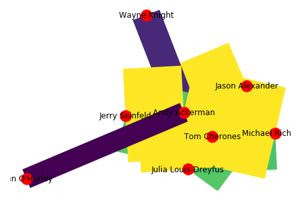
For directors (using writers), Andy Ackerman and Tom Cherones have the strongest relationship.


For writers (on directors), Larry David and Andy Robin are most central.

Number of Nodes:
39

Number of Edges:
503

Degree:
[('Larry David', 38), ('Andy Robin', 37), ('Bill Masters', 37), ('Bruce Kirschbaum', 37), ('Carol Leifer', 37), ('Jerry Seinfeld', 37), ('Max Pross', 37), ('Peter Mehlman', 37), ('Tom Gammill', 37), ('Bob Shaw', 27)]

Closeness:
[('Larry David', 1.0), ('Andy Robin', 0.9743589743589743), ('Bill Masters', 0.9743589743589743), ('Bruce Kirschbaum', 0.9743589743589743), ('Carol Leifer', 0.9743589743589743), ('Jerry Seinfeld', 0.9743589743589743), ('Max Pross', 0.9743589743589743), ('Peter Mehlman', 0.9743589743589743), ('Tom Gammill', 0.9743589743589743), ('Bob Shaw', 0.7755102040816326)]

Betweenness:
[('Larry David', 0.05465465465465468), ('Andy Robin', 0.031657973763236945), ('Bill Masters', 0.031657973763236945), ('Bruce Kirschbaum', 0.031657973763236945), ('Carol Leifer', 0.031657973763236945), ('Jerry Seinfeld', 0.031657973763236945), ('Max Pross', 0.031657973763236945), ('Peter Mehlman', 0.031657973763236945), ('Tom Gammill', 0.031657973763236945), ('Bob Shaw', 0.01744902797534377)]

Eigenvector:
[('Larry David', 0.21030975623673595), ('Andy Robin', 0.2096838595527111), ('Bill Masters', 0.2096838595527111), ('Bruce Kirschbaum', 0.2096838595527111), ('Carol Leifer', 0.2096838595527111), ('Jerry Seinfeld', 0.2096838595527111), ('Max Pross', 0.2096838595527111), ('Peter Mehlman', 0.2096838595527111), ('Tom Gammill', 0.2096838595527111), ('Bob Shaw', 0.16677389157526631)]

Pagerank:
[('Larry David', 0.04290513400304048), ('Andy Robin', 0.04105116362562973), ('Carol Leifer', 0.04105116362562973), ('Jerry Seinfeld', 0.03953773990716651), ('Bruce Kirschbaum', 0.038789268664957834), ('Bill Masters', 0.03878926866495783), ('Max Pross', 0.03878926866495783), ('Peter Mehlman', 0.03878926866495783), ('Tom Gammill', 0.03878926866495783), ('Bob Shaw', 0.026201129486917826)]


For cast (on writer), we see two distinct groups.


Finally, let's combine writers, directors, and cast into a single graph.


As this is difficult to see, We put it into Gephi for better visualization.


Conclusion

Obviously un-ending details and depth could be explored with this data, but we have revealed obvious facts (e.g., Jerry, Kramer, George, and Elaine are central cast members) as well as some not so obvious facts (e.g., seasons 1-5 clustering vs. seasons 6-9, Larry David is the main writer, Andy Ackerman and Tom Cherones are the main directors). We have also shown a variety of connections among the cast members, directors, and writers at the series, season, episode, and scene levels. A much more detailed analysis is certainly worth pursuing. What has been done here, while useful, is merely a starting point for further exploration of this great show by means of social network analysis.

Friday, January 4, 2019

Popular Ontology: Self Classification

Ontology is the study of being, and includes a study of what exists and the various categories or classifications that existing things fall into at the most fundamental level.  While philosophy has traditionally been focused on properties, substances, possible worlds, and other rather abstract ontological entities for categorization, I have noticed that there is a lot of popular ontology these days. These popular ontologies carve up the human race into various kinds (usually four types of some kind), and one can usually find out what one is by taking some sort of online test.

Most tests apply to one's personality in some way, while others relate to one's physicality. Combined, one can gain at least an initial understanding of what sort of body/soul composite one is, and how one is different from the other body/soul composites in one's work, social, and family life.

As my wife and I frequently discuss various schemes of these categorizations and what we each are, I figured a running list might be useful to keep track of them all.  At least so I remember who and what I am...

Here is my popular ontology so far:

Personality
  1. INTJ
    • The Architect/Scientist
    • Introverted, intuitive, Thinking, Judging
    • Myers-Briggs
  2. Upholder
  3. 4 (deep thinking, reflective), 3 (active, dynamic)
  4. Melancholic, Choleric
  5. Reformer (1), Investigator (5)
  6. Observer (blue, red/green, yellow)

    Physicality
    1. Yang natural
    2. Dark Winter

    What is your popular ontology?

      Wednesday, January 2, 2019

      Energy Usage: Global and Home

      The below text was taken from my final project for a data visualization course in my MS Data Science program, completed in December 2018.  The full text and Shiny app are located here: https://carsonar.shinyapps.io/energyusage/.

      Screen shots of the Shiny App:

      Global Energy Usage:


      Home Energy Usage:


      --------------------------------

      Introduction

      Whatever the cause, it is widely believed that the environmental effects of climate change are having and will continue to have a largely negative impact on people around the world, and in particular, on the poorest and least capable of adjusting to the change through the use of resources. In addition, the higher cost of cleaner alternative energy that will lessen the assumed cause of global warming (i.e., C02 emissions) will be more burdensome to the poorest people and countries. Regardless of one's beliefs about the causes of global warming, the responses to it are a serious matter of social justice.

      If CO2 emissions are the primary cause, then reducing energy usage (when the burning of fossil fuels for energy production to sustain energy consumption produces those CO2 emissions) is one way of combating global warming and addressing this matter of environmental and social concern. Hence, it is important for businesses and homeowners to understand what factors increase energy usage, what might be done to reduce energy usage, and thereby reduce their contribution to CO2 emissions.

      The task of this project is to visually demonstrate and understand the prominent factors that lead to increased energy usage at the local level. To motivate this effort, I first produce visualizations that show the correlation between global energy usage, CO2 emissions, and global relative average temperatures. Having demonstrated the strong correlations among these three, I next produce visualizations that show how home energy usage relates to various factors responsible for my home energy usage increasing and decreasing, including: local temperature, time of day, day of week, month, and (inferred) appliances/devices in use.

      Visualizations

      The visualizations referred to are located on the “Global Energy Visuals” and “Home Energy Visuals” tabs in this Shiny app.

      Data Sources

      The data sources are:

      All the above data has been exported for use in the visualizations and is located here:

      Parameters of the Data

      The data sources above combine into two different data sets with the following parameters:

      Global

      • Energy Production and Consumption
        • Nuclear, exports, imports, stock change/other, fuels, renewable, and totals.
        • Unit: Quadrillion BTU
      • CO2 Emissions
        • Gas fuel, liquid fuel, solid fuel, cement production, gas flaring, per capita, and total.
        • Unit: million metric tons of Carbon
      • Global Temperature Change
        • The change in global surface temperature relative to 1951-1980 average temperatures (mean relative temperature), Lowess smoothed mean relative temperature
        • Unit: degrees Celsius
      • Year

      Home

      • Calendar
        • Year, month, date, hour, day of the week, and day (of the month).
      • Watt Hours
        • Total and average; port A, port B, and total.
        • Unit: Watt hours
      • Daily Temperature
        • Maximum, minimum, average, difference from 65 degrees.
        • Unit: degrees Fahrenheit
      • Daily Dewpoint
        • Maximum, minimum, average
        • Unit: degrees Fahrenheit
      • Humidity
        • Maximum, minimum
        • Unit: percentage %
      • Windspeed
        • Maximum, minimum
        • Unit: mph
      • Pressure
        • Maximum, minimum
        • Unit: Hg
      • Precipitation
        • Average
        • Unit: inches

      A Summary of the Current Debate and Challenges with the Data

      The current debate around global warming may be summarized as follows. The global warming proponent believes that it is caused by human made CO2 emissions. Consequently, we should take steps to reduce those CO2 emissions to avoid increasing the earth's global average temperature which will be destructive of plant, animal, and human life. The global warming skeptic believes that the warming is part of a natural cycle and processes that create heating and cooling on earth (e.g., volcanic activity, sun activity), and that this is largely independent of human CO2 emissions. Consequently, the increase in CO2 emissions has coincidentally happened at the same time as a natural increase in global average temperatures, but this is mere coincidence. See http://www.longrangeweather.com/global_temperatures.htm for a chart showing this heating and cooling cycle . Furthermore, such heating may actually be beneficial, at least for humans, given that periods in history where humans flourished coincided with periods of warmer than average temperatures. The global warming proponent might accept that natural cycles in heating and cooling do occur and perhaps that we are in such a cycle, but would counter that human activity has dramatically increased the rate and levels at which the earth's natural heating cycle has occurred, and that such an increase is not environmentally sustainable or beneficial.

      If we had actual measurements of C02 emissions and atmospheric totals going back centuries along with global average temperatures to match, perhaps this debate could be resolved by rigorous data analysis on this data. However, temperatures prior to 1880 are inferred by proxy (see https://en.wikipedia.org/wiki/Proxy_(climate) for details), and different methods (and models) give significant and differing results. The same is true for CO2 emissions and atmospheric totals prior to the 18th century. Consequently, these errors and variances in models of CO2 levels and emissions and global temperatures are further compounded in any model attempting to predict global temperatures from CO2 emissions as distinct from other factors.

      Strengths and Weaknesses of this Particular Dataset

      The global data is primarily limited by the years available. While the carbon emissions data dates to 1751, the global temperature data is not available until 1880. The energy data isn't available until 1949. Consequently, comparison among these variables is limited by the variable with the fewest number of data points. However, while limited in the number of years of data available, the global data does have useful breakouts by type of carbon emissions and type of energy production and consumption. This allows for a more improved analysis to determine precisely which kinds of carbon emissions and which kinds of energy production and consumption are most associated with global temperature increases.

      The home energy data is extremely detailed and there are lots of data points. The weather data is complete and could only be improved by having the data at an hourly or minute level of granularity. The biggest limitation is in the energy usage data. While I have the totals for given points in time, I cannot directly observe which appliances are using the energy. For example, I have no data showing the energy usage breakouts for the refrigerator, the heaters/AC, the hot water tank, or the stove/oven. I can infer which appliances are in use based on the day and time of the energy usage and my knowledge of our family's home appliance and electrical usage, but I cannot directly and conclusively show where the energy is being used the most.

      Analysis: Visual

      Global

      The data shows that there is a strong correlation between carbon emissions and increasing average global temperatures since 1880 (in my visualization, a simple linear model returns an R2 of 0.82). This supports the widely accepted view that carbon emissions are the cause of increasing average global temperatures.

      Those carbon emissions are (presumably) the direct result of energy production and consumption (my simple linear model returns an R2 of 0.89 between energy consumption and carbon emissions). Energy production largely consists of burning fossil fuels which produces CO2 emissions.

      Home

      To understand energy usage at the local home or business level, I used my own home energy usage over the course of a year and related that information to the local weather, which I assumed to be among the major factors associated with energy usage. Based on the visualization below, I can immediately see that there is a rough negative linear relationship between temperature and energy consumption (lower temperature = higher energy usage; R2 = 0.5).

      However, knowing that I have air conditioning, I can see that energy usage goes up a bit when the temperature is above 70 degrees and the air conditioning is turned on. Thus, a main energy consumer in my home are heaters and air conditioning, where increasing energy usage is associated with more extreme (hot or cold) temperatures outside. This can be more easily shown comparing the absolute temperature difference between the daily temperature and 65 degrees with total energy usage. A simple linear model returns an adjusted R2 of 0.62.

      Another source of energy consumption can be inferred from the two bottom charts on the “Home Energy Visuals” tab. The highest peaks in energy usage are in the morning, followed by a lull midday with some lesser peaks around dinner time. The peaks correspond to water usage, more specifically, hot water usage, and kitchen appliance usage. The morning peaks correspond to daily showers while the dinner time peak corresponds to hand washing dishes, bath-time for the kids, running the dishwasher, and on certain days, doing laundry. The stove and oven are also primarily used at dinner time.

      Analysis: Regression

      Global

      When predicting global mean relative change in temperature, a linear model that considered the following variables returned a model with an adjusted R2 of 0.88:
      • CarbonEmissions_GasFuel
      • CarbonEmissions_LiquidFuel
      • CarbonEmissions_SolidFuel
      • CarbonEmissions_CementProd
      • CarbonEmissions_GasFlaring
      • EnergyConsumption_Nuclear
      • EnergyProd_Nuclear
      • EnergyStockChangeOther
      • EnergyConsumption_Fuels
      • EnergyProd_Fuels
      • EnergyConsumption_Renewable
      • EnergyProd_Renewable

      Using StepAIC to automatically reduce the variables produced a model with an adjusted R2 of 0.89, and contained the following variables, each of which was statistically significant at 0.05 or lower:
      • CarbonEmissions_LiquidFuel
      • CarbonEmissions_CementProd
      • CarbonEmissions_GasFlaring
      • EnergyConsumption_Renewable

      Liquid fuel and cement production emissions were positively correlated with global mean temperature relative change, while gas flaring and energy consumption from renewables were negatively correlated.

      A model that considered only energy consumption and production in predicting global mean temperature relative change yielded a model with an adjusted R2 of 0.87. The variables that remained in the model after StepAIC were:
      • EnergyConsumption_Nuclear
      • EnergyStockChangeOther
      • EnergyConsumption_Fuels
      • EnergyProd_Renewable
      Energy consumption from nuclear sources was positively correlated, along with energy production from renewables. Stock change and consumption from fuels were negatively correlated. A model only considering total energy consumption and production yielded a model with an adjusted R2 of 0.70, where after StepAIC, only the consumption variable remained. It positively correlated with global mean temperature relative change. However, due to missing energy data prior to 1950, the small number of data points should make us cautious in taking this model too seriously.

      A model that only considered carbon emissions in predicting global mean temperature relative change yielded a model with an adjusted R2 value of 0.85. After StepAIC, each of the following variables was statistically significant at 0.001:
      • CarbonEmissions_GasFuel
      • CarbonEmissions_LiquidFuel
      • CarbonEmissions_CementProd
      • CarbonEmissions_GasFlaring
      Emissions from gas fuel and gas flaring were negatively correlated, while emissions from liquid fuel and cement production were positive correlated with mean temperature relative change. A model only considering total emissions produced a model an adjusted R2 of 0.82, where total carbon emissions were positively correlated.

      To summarize, in comparing energy production and consumption to carbon emissions as factors in predicting global mean temperature relative change, it appears that carbon emissions are more statistically significant. This should not surprise us as most energy production and consumption produces CO2 emissions, and thus energy production and consumption will be highly correlated with increasing global mean relative temperatures if CO2 emissions are in fact the cause of increasing global temperatures. However, energy production and consumption are presumably the remote causes of global warming, while carbon emissions are presumably the primary proximate cause of global warming. Thus, it should not surprise us that carbon emissions, being more directly related, should be more statistically significant in predicting the global mean relative temperature.

      Home

      When predicting total Watt hours (Wh_Total) for a given day at my house, a linear model consisting of the following variables returned a model with an adjusted R2 of 0.68:
      • DayOfWeek
      • Month
      • Temp_Max
      • Temp_Min
      • Temp_Avg
      • Temp_Avg_AbsDiff65
      • DewPoint_Avg
      • DewPoint_Max
      • DewPoint_Min
      • Humidity_Min
      • Humidty_Max
      • WindSpeed_Max
      • WindSpeed_Min
      • Pressure_Max
      • Pressure_Min
      • Precip_Avg

      Most variables were not significant, although the following were:
      • DayOfWeekMonday - positively correlated and added much more than other days. This is our primary laundry day.
      • Months: August, December, January, February - the hottest month and the coldest months in which the AC or heat is working the hardest. All were positively correlated and had much higher magnitudes than other months.
      • Temperature: while the min and average were significant, the most important variable was Temp_Avg_AbsDiff65, that is, the absolute difference between the day's average temperature and 65 degrees. I had determined 65 degrees to be the temperature at which the AC/heater had the lowest energy usage, so any deviation above (AC) or below (heat) would be drawing more energy.

      After having binarized the character variables, I ran StepAIC on the above model to reduce the variables to those that were most significant. A model with an adjusted R2 of 0.69 resulted. Most significant were:
      • Temp_Avg_AbsDiff65 - positively correlated
      • DayOfWeek_Monday - positively correlated and adding a large amount in magnitude.
      • Months: September, October, March, April, May: negatively correlated, accounting for the milder weather and reduced need for heating and cooling (and thus, less need for energy usage).
      Finally, to remove any variables that were highly correlated with each other (e.g., Temperature average vs temperature min vs. temperature max), I selected only those variables that were most significant in each grouping, where the groups were temperature, windspeed, pressure, dewpoint, and humidity. The result was a model whose variables were all statistically significant at 0.1 and most were significant at less than 0.001. With an adjusted R2 of 0.68, the model contained the following variables and had the following average contributions to the Watt hour total prediction for a particular day:
      • Intercept: 31,972 watts per day
      • Temp_Avg_AbsDiff65: 738 watts added per degree away from 65 degrees
      • Dewpoint_Avg: -395 watts added per degree
      • Humidity_Max: 197 watts added per humidity percent
      • Days:
        • DayOfWeek_Monday: 5637 watts added
        • DayOfWeek_Wednesday: 1995 watts added
        • DayOfWeek_Saturday: 2125 watts added
      • Months
        • September through November: negatively correlated, with October contributing -9131 watts to the model.
        • March through June: negatively correlated, with March and May contributing -8366 and -8026 watts respectively.
      Consequently, I see these two major factors in predicting energy usage at my home:
      • Temperature/weather (including dewpoint, humidity, and month)
      • Hot water usage (inferred from day of week):
        • Monday - primary laundry day
        • Wednesday and Saturday - primary bath days for kids

      Conclusion

      The impact of increased global temperatures and ways of responding to these increased global temperatures is a matter of environmental concern and of social justice. Consequently, one should care about energy production and consumption in relationship to global warming, for if one can reduce energy production and consumption (at least where such production and consumption comes from CO2 emission producing processes), one should be able to reduce one's impact on global warming if CO2 emissions are the primary cause of increasing global temperatures.

      If this is true, what can a responsible average person do to reduce global warming? A straightforward thing to do is to reduce one's energy consumption, thus reducing the need to produce that energy by burning fossil fuels that produce CO2 emissions. How can one reduce one's energy consumption? One must first understand where that energy consumption is largely coming from and what factors play into increasing or decreasing energy consumption. Once understood, one can determine how best to reduce one's energy consumption by targeting these contributing factors.

      Understanding these factors is what I have attempted to do in this project. While a more detailed analysis could be undertaken to more specifically understand the causes of energy consumption in my home, it seems that the primary sources of energy consumption come from heating/cooling the air inside the house (related to the temperature outside) and heating the water (related to hot water usage inferred from day and time of energy usage).

      Having identified these factors, these can be targeted for reducing energy consumption in my home through:

      • Better insulation, which would counteract the need for heating and cooling the home through heaters and air conditioners. This would make the energy usage less dependent on the outside temperature.
      • More efficient appliances, especially, a hot water tank, that use less energy to produce the same result (e.g., hot water, a heated stove and oven).
      With these relatively simple home improvements, energy consumption could be reduced, thus lowering the need to produce that energy by burning fossil fuels which produce CO2 emissions that presumably contribute to global warming. While such measures would have no noticeable global impact if only done by myself, such measures would likely have an impact if implemented by most homeowners and business owners in the world such that a significant reduction in energy consumption (and hence production) was achieved.