Introduction
I recently had the misfortune of paying about the same in repairs for my car as its original used purchase price. While the majority of the repairs were due to normal wear (e.g., brakes, bushings), I couldn't help wondering whether it would be better to sell the car and get something "new". If you are like me, I am sure you have asked the question yourself whenever a major car repair has been presented to you: to fix, or not to fix (and instead sell and then buy again)? That is the question.But how could I answer the question? Then like any good data scientist, I thought, "hey! why don't I do a simulation and see what happens." So I did, and the results of my simulation are below.
The Setup
I wanted to be able to answer the following questions:- What age of a car is cheapest to own on a monthly basis?
- At what point should you sell your car and buy a new or used one?
- A new car costs on average $33,000 with a normal standard deviation of $3,000.
- A car depreciates 20% - 30% in the first year and 15% - 18% each year after that.
- A typical car payment is divided over 5 years (60 months) with a 7% interest rate.
- A car is driven about 15,000 miles per year with a normal standard deviation of 2,000 miles.
- Maintenance:
- Oil
- Changed every 3,000 miles with a normal standard deviation of 500 miles.
- Costs $40 each with a normal standard deviation of $2.
- Brakes
- Replaced every 60,000 miles with a normal standard deviation of 10,000 miles.
- The cost is $501 with a normal standard deviation of $40.
- Transmission
- Replaced every 150,000 miles with a normal standard deviation of 20,000.
- The cost is $3,750 with a normal standard deviation of $562.
- Struts and shocks
- Replaced every 50,000 miles with a normal standard deviation of 10,000 miles.
- The cost is $804 total with a normal standard deviation of $101.
- Spark plugs
- Replaced every 40,000 miles with a normal standard deviation of 5,000 miles.
- The cost is $878 total with a normal standard deviation of $33.
- Timing belt
- Replaced every 60,000 miles with a normal standard deviation of 10,000 miles.
- The cost is $560 with a normal standard deviation of $95.
- Air filter
- Replaced every 15,000 miles with a a normal standard deviation of 1,000 miles.
- The cost is $69 with a normal standard deviation of $2.
- Fuel filter
- Replaced every 25,000 miles with a normal standard deviation of 2,000 miles.
- The cost is $91 with a normal standard deviation of $4.
- Battery
- Replaced every 35,000 miles with a normal standard deviation of 3,000 miles.
- The cost is $210 with a normal standard deviation of $12.
- Tires
- Replaced every 60,000 miles with a normal standard deviation of 10,000 miles.
- The cost is $500 total with a normal standard deviation of $40.
- Assumptions:
- Any other maintenance cost is either trivial (e.g., headlights), would not impact the final conclusion, or would force a sale or insurance write-off (e.g., new engine).
- All maintenance that SHOULD have been done before a certain mileage is assumed to have been done and is NOT factored into the cost of purchasing a used vehicle.
- Insurance costs and registration costs have not been factored in, although I would expect newer cars to have higher insurance and registration rates than older cars.
Simulation 1: Buy a Car and Drive Until Its End Of Life
My first simulation is that of buying a car of various ages (0-17 years old) and then driving it until it reaches the end of life (defined as 250,000 miles or about 17 years). For each car age 0-17 years old, I ran the simulation using the above variables 50 times (think of this as 50 different cars for each age). Obviously, the newer cars lasted longer than the older cars. But what was the value of that longer life?Looking at the average cumulative cost of a car by car age over its lifetime, we see that, generally speaking, the newer the car, the higher the cumulative cost over the lifetime of the car. The cars fan out pretty rapidly in the first 5 years (when one is paying off a car payment), but after the first 5 years, the cumulative car costs run roughly parallel to each other in a very shallow upward trajectory. So it would appear that the main cost difference in car age is the purchase price, and after 5 years, all cars appear to cost roughly the same amount on average to maintain.

This is easier to see in the following charts. In the first, the average monthly cost by car age over time is shown. You can see a sharp drop in cost at 60 months (5 years). After that, it is a bit hard to see any clear difference between the monthly costs by car age.


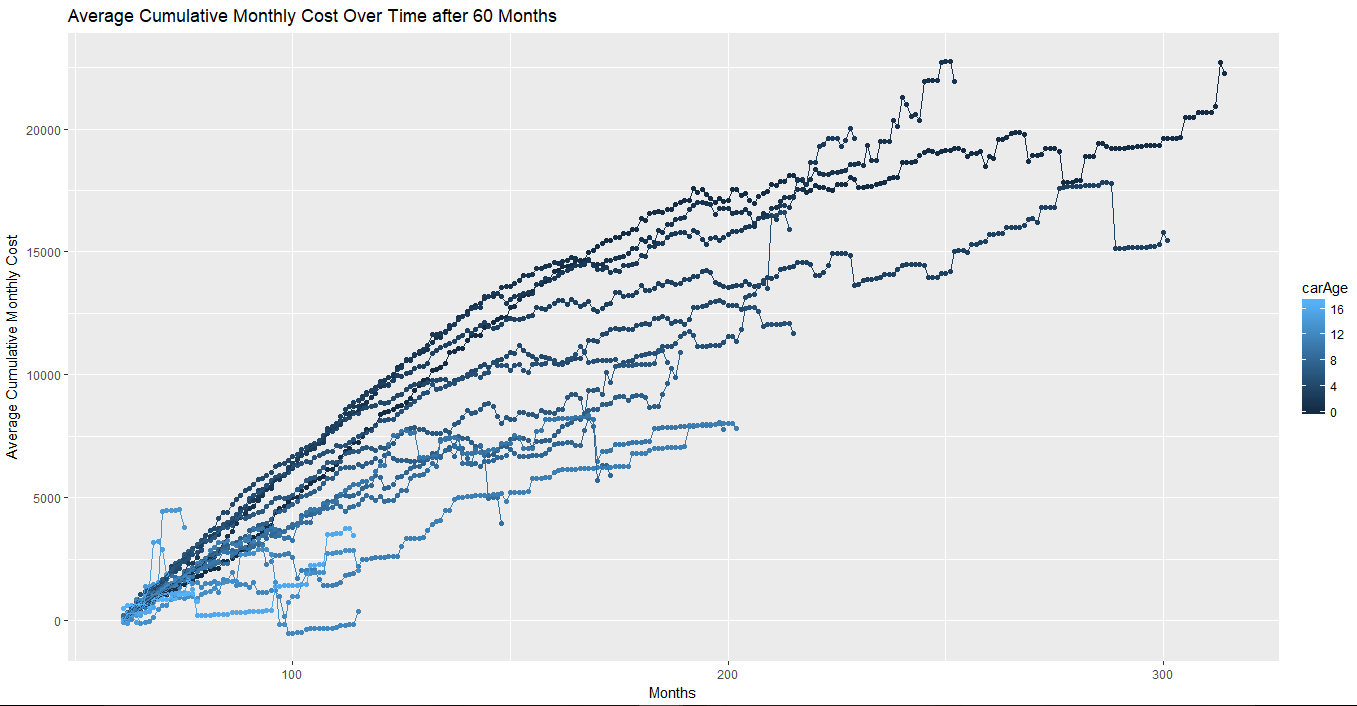
In this third chart, I have removed the cumulative cost up through 60 months so that we can see what the cumulative cost is after 60 months until the end of life for the car. One can see that the cumulative car costs are much more similar after 60 months. There is now some interweaving of cumulative costs, although it is a little difficult to comes to any definitive conclusion when looking at this.
Overall, there is a pretty clear linear relationship between monthly car cost and car age. With an R^2 of 0.97, an average monthly car cost (repairs, car payment, and resale value) starts at $274 and is about $10.60 less for each additional year of car age.

If we remove the first 60 months (remove the car payments) and remove the last month of ownership (any money gained by selling the car) and look again at the relationship between average monthly car cost and car age, we see that new cars do indeed still cost slightly more over the course of their lifetime ($150) than used cars do ($75-$100). There is more variability for older cars, likely indicative of the fact that one may purchase an old car and then get stuck with a costly repair immediately, or may get lucky and have very few repairs before reselling again in a few years. There are also fewer data points for older cars, so the average is going to be less stable.

Key Takeaways from Simulation 1
- A new car will cost about $60,000 total over the lifetime of the car when including both the initial cost of the car ($33,000), car maintenance costs, and resale value. A used car (16 years old) or a succession of multiple used cars would cost about $28,000 over the equivalent span of time. That is less than half!
- The major difference between the lifetime cost of a new and used car is the initial car payment. The older the car, the smaller the average monthly cost due mostly to a smaller initial cost for the car.
- Over the lifetime of a car (17 years or 250,000 miles), a new car will cost about $277 per month whereas a used car (10+ years) will cost between $100-$150 per month. This includes the purchase price, maintenance costs, and resale value at the end of its life.
- After car payments are complete and without considering the resale value of the car at the end of its life, a car purchased as new will cost about $132 per month while a used car (10+ years) will cost closer to $105 per month.
Simulation 2: Replace Car After Owning for a Fixed Number of Years
We probably shouldn't place too much weight on the above scenario. I bet that most people don't drive a car till the end of its life. Instead, we own a car for a certain number of years and then replace it with a similar car, and then own that car for a similar certain number of years. This cycle repeats. Second, given how I set up the above simulation, the number of data points are not the same for each car age and this isn't good from a data analysis perspective since we are trying to compare car ages against each other. I adjusted the simulation to address both concerns and the results of that are below.Suppose instead of purchasing a car and then driving it until the end of its life, what if you bought a car and drove it for a fixed number of years before replacing it. Assuming you replaced your car with a car similar to what you originally purchased, what would your average costs look like then? I reran the simulation for cars of ages 0-20 years old with the assumption of owning the car for 5, 10, 15, 20, or 25 years. At the end of the fixed number of years, the car was sold for the depreciated value (e.g., a car purchased as new would then be sold for the depreciated value of a 5-year old car at the end of 5 years).
You can see that each chart below looks similar to the very first chart above. For a 5-year threshold, we see that the bulk of the cost is again in the car payment. As the fixed number of years for owning the car increases, the average cumulative costs runs roughly in parallel lines, with newer cars always being more expensive than older cars, but that difference is roughly fixed.


What about average monthly cost over time for all car ages and years of ownership? Similar to a chart above, we can see that for the first 5 years, the average cost of ownership (car payments and maintenance) is around $300 per month. After that, the cost of ownership (maintenance only since the car has been paid off) is about $150 on average, with a normal variation between $75 and $225 month to month.

If we look at the average monthly cost for each of the fixed years of ownership, we see that the longer a person owns a car, the less that car costs per month. This is especially true for newer cars than older cars. For example, a new car drops from $451 a month on average from 5 years of ownership to $247 a month on average at 25 years of ownership. In contrast, a car of 20 years in age starts at $154 a month on average and goes to $146 a month on average. As the years of ownership increases, the lines below flatten as the maintenance cost difference between a car purchased as new and a car purchased as used decreases. I would expect that as we increased the years owned to infinity, the line would flatten completely, with an average monthly cost of about $150.

Here is the same information presented in one plot. For new cars, the years of ownership make a big difference in the average monthly cost. But it matters very little for older cars, which cost roughly the same per month no matter how long you own it.

This relationship among car age, years of ownership, and average monthly cost is a bit easier to see in the following chart. A red color circle has a high monthly cost of ownership whereas a green color circle has a low cost of ownership. We see that the most expensive option is to own a new car for 5 years. The longer this new car is owned, the less expensive it is per month on average. However, as the car age at purchase increases, the average monthly cost is green at each years of ownership threshold.

Finally, a quick linear model with an R^2 of 0.74 states that one starts with an average monthly cost of $310. Then for every year of car age, subtract $7.31, and for every year you plan to own the car, subtract $2.80. So we can see again that car age matters most in determining the monthly cost of a car: newer cars cost more.
What if we remove the first five years of ownership when one is paying for the original purchase of the car, as well as the money regained from selling the car at the end of ownership? Then just as we would expect from previous charts, the maintenance costs are roughly the same for each age of car and each length of ownership. It doesn't matter if your car was purchased new or used or if you own the car for 5 more years or 25 years: you are going to pay $150-$200 per month for maintenance costs.


Key Takeaways from Simulation 2
- New cars cost more on average per month than used cars, but the bulk of that difference is determined by the initial car payment and NOT by maintenance costs.
- The longer a person owns a car, the less that car costs per month on average.
- When ignoring car payments and resale value, the average cost of owning a car (i.e., the regular maintenance costs) are roughly the same for all car ages and all lengths of car ownership.
- Average Monthly Costs across all cars:
- Include car payments and include resale value: $183
- Include car payments and exclude resale value: $193
- Exclude car payments and include resale value: $138
- Exclude car payments and exclude resale value: $145
- Car Ownership milestones across all cars:
- First 5 years (car payments): $273 per month
- Maintenance after car payments complete: $145 per month
- Average Resale value: $1,059
What Should You Do?
I wanted to answer the following questions:- What age of a car is cheapest to own on a monthly basis?
- At what point should you sell your car and buy a new or used one?
So when should you sell your car? First, it seems you should hold on to your car as long as possible from a cost perspective, especially if it is relatively new. After 15 years, this isn't as important as the initial expense of purchasing the car has averaged out over time. Second, if faced with a costly repair and you can replace your car for about the same amount that the repair would cost AND you can be reasonably certain that you won't immediately have a costly repair, then that seems to be an appropriate time to replace your car. Third, if you aren't happy with your car anymore (reliability, performance issues, look, life situation has changed, etc.) then maybe it is time to move on. Money isn't the only important consideration.
So what should you buy? First, prioritize older (i.e., cheaper) used cars that fulfill your functional criteria. You are going to pay the same for maintenance costs on average, so the main cost is the initial purchase price. If that is lower, then you will save money. Second, if you do opt for a used car, get repair history and see what repairs have been done recently (and which are likely to come up soon). A car that has had a lot of recent repairs is likely a good purchase: you won't have to do them yourself. Be suspicious of an old car with very few repairs, as you will likely have to make these very soon. Third, if you purchase a new car, own it as long as possible to drive down your average monthly cost. Don't buy a new car if you are going to sell it in a few years.
Conclusion
Personally, since May 2013, we have owned 2 cars. Both cars are now 16 years old (2002 model year). Since that time, we have paid about $253 per month in maintenance costs and repairs. Splitting in half, that is $126.50 per car per month on average. Given the above analysis, I'd say that is pretty good. Did I make the right decision to get our car fixed recently instead of trying to find another car? I doubt I could have replaced it for a cheaper total price. The cost was routine maintenance that would need to happen on a similar car so I'd likely have to pay for a costly repair soon anyway. We are otherwise happy with our car and plan to own it for at least another year or two. So it seems that given the foregoing considerations, it was a good decision.Cars are expensive. Gas, insurance, registration, initial cost, and repairs all make for a very costly monthly bill. But there are ways to make it a little less expensive on average. In short, buy used, own for a long time, and don't be freaked out by the occasional high repair cost: it will average out in the end.
