Friday, October 2, 2015

A Brief History of Kicking: NFL 1976-2014


Introduction

While gathering data for developing predictive models for NFL game results (see here), I have been looking into general statistics about NFL games and players.  Here is a look into the history and statistics of kicking and punting in the NFL since 1976.

The Dataset

I gathered the Kicking tables for each NFL team for each year from 1976 -2014.  Included is a record for every player that kicked a field goal or extra point, or who did a punt.  The fields included Age, Position, field goal attempts and field goals made for 0-19, 20-29, 30-29, 40-49, and 50+ yard categories.  Also included were extra points attempted and made, punt counts, punt yards, longest punts, blocked punts, and yards per punt.  There were 2,923 such records.  Below are some "random" facts.
  • Player Number
    • The most popular Kicker or Punter player number is 4.
    • 78% of Kickers or Punters have a player number between 0 and 10; 20% between 11 and 19; 2% between 20 and 90.
  • Age
    • Most common age of Punters and Kickers is 24
    • Youngest Punter/Kicker was 22;  oldest was 47
      • Oldest: Morten Andersen, kicker for Falcons through 2007.  He started his career in 1982 at age 22 as a kicker for the Saints.
    • As we would expect, the amount of players per age decreases as age increases:
  • Position
    • Most punts/fields goals are performed by punters and kickers.  However, 43 records were QBs, and many others were WRs, FBs, and practically every other position at least once.
      • The last QBs to punt were Ben Roethlisberger and Tom Brady in 2013.  Tom outkicked Ben 32 yards to 28 yards.
      • Chris Miller of the 1989 Falcons, a QB, kicked and made a field goal.  He is the only QB to do so (in this dataset).
      • Tony Galbreath, a fullback in 1979 for the Saints, made 2 of 3 field goals.
      • Brian Sipe, Dan Pastorini, Pat Ryan, and Rick Neuheisel, all QBs, each has attempted an extra point.  All made it except for Dan Pastorini.
      • Danny White played as a QB and punter for the Cowboys in the early 1980s. 
      • Ted Thompson, a linebacker for the Oilers in 1980, made all 4 of his extra points.

Fields Goals Over Time

How have field goal attempts, mades, and percentages changed since 1976?  Below is a chart to show how Field Goal Attempts Per Team and Field Goals Made Per Team have changed over time by the range categories of 0 to 19 yards, 20 to 29 yards, 30 to 39 yards, 40 to 49 yards, and 50+ yards:


As this is a little hard to see, here is each category broken out into separate graphs:

Here is what we can see about field goals:
  •  0 to 19 have decreased over time.
  • 20 to 29 have increased and decreased, but seem to have stabilized.
  • 30 to 39, 40 to 49, and 50+ have all increased.

Here is a video which shows this progression over time.  The size of each plot is the field goal percentage (mades/attempts):


You may have noticed something funny in 1982.  The number of Field Goal Attempts per team suddenly dropped, and then went back to a more normal state in 1983.  This is due to the fact that in 1982, NFL players went on strike.  Consequently, only 9 regular season games were played of the usual 16 games, and hence, there were fewer games in which field goals could take place (so fewer field goals).

1976 vs. 2014


We can see that the most dramatic change is in the 50+ category, from very few (and rarely successful) to pretty common (and moderately successful).

We can look at this data in a different way, plotting the yards on the x-axis and the FG percentage on the y-axis for each category (using the midpoint to estimate the category), and then plot each year to see how the percentage has changed over time for each category:


We can also look at Field Percentage Over Time, with Year on the x axis and FG_Percentage on the Y axis, broken out by the FG_Yardage:


Field goal kickers are getting much more consistent in making their field goals.  Again, the most dramatic is the 50+ category, going up from below 25% to over 60% in accuracy.  Here is a video showing the change over time:


1976 vs. 2014


In 1976, we would estimate the maximum range for a field goal kicker to be just over 60 yards:


In 2014, although a much riskier estimate (we'd need more detailed data beyond 50 yards), we could estimate the maximum range for a field goal kicker to be just under 80 yards:


What is, in fact, the longest recorded NFL field goal?  It looks like it is 64 yards by Matt Prater in 2013.  College football has seen a 69 yard field goal, and high school a 68 yard field goal.  So probably an 80 yard field goal is overly ambitious, but a 70 yard field goal is definitely possible in an NFL game.  I wouldn't be surprised to know that NFL kickers have, during practice, kicked a field goal over 70 yards.  However, since a missed field goal could mean great field position for the other team, coaches may be reluctant to try the maximum range for their kickers in actual play.


Extra Points Over Time

Extra points are being kicked more over time (probably because more touchdowns are occurring), and these are being made more frequently than in the past.  For example, in 1976, 81 of 898 XPs were missed.  In 2014, only 8 of 1230 were missed.  So an XP is now almost practically guaranteed (although with the recent rule change backing up the XP, this may no longer be the case in 2015 and beyond).


Punting Over Time

The NFL has had about 70 to 80 kickers/punters per year pretty consistently.  Except for 1987, when this shot up to 137 from 74, then back down to 77.  What happened?  Well, in 1987, there was also an NFL player strike, except this time, replacement players were used for several games.  Hence, each team had 2-3 replacement punters/kickers and 2-3 regular punters/kickers that played at some point in the season.

Punt counts have stabilized near about 2,500 per season.  A low point (ignoring 1982) occurred in 1990,  but increased to present day levels around 1997.


While average punt counts per team are about 70 per season, max punt counts per season are between 100 and 110.  In 2014, the most punts were 109 for the Raiders' punter.  This isn't surprising since the Raiders were 3-13.

Punt yardage has been increasing over time.  Since the number of punts has somewhat stabilized, this suggests that punters are getting longer punts on average.


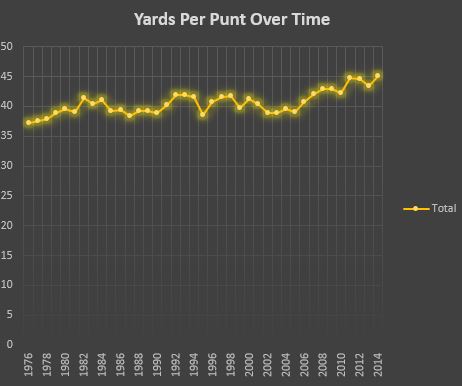
When we look at Yards Per Punt, the average for all teams each year has been modestly increasing over time.  So this also suggests that, in general, punters are getting better at getting longer punts.


The longest punts each season range from the upper 70s to lower 90s.  The longest punt in this timeframe is 93 yards by Shawn McCarthy of the 1991 Patriots.  The second was 91 by Randall Cunningham in 1989 for the Eagles.  Amazingly, Randall Cunningham is a QB.  He punted 6 times that season.  He also had the highest yards per punt average in 1994 of any player at 80.  Of course, he only punted once that season...

Most punters get a punt blocked once each season.  However, the most anyone gets blocked each season is generally about 3 times.  Blocked punt counts over time have been pretty erratic, but they are perhaps making a comeback, with 23 in 2014, up from 6 in 2009.


 Conclusion

I hoped you enjoyed this brief history of kicking through the eyes of statistics.   With recent rule changes and so many games being decided by a single field goal (or missed field goal), the importance of , in particular, field goal/extra point kickers is likely to only increase in coming years. That is, the quality of a kicker will likely play a huge role  in determining whether a team is successful or not.  We shall see.

-------------------------------------------------------------------------------------------------------------

Note: a friend pointed me to this article several days after I posted my article.  I did not know about this article at the time of my writing or publishing, but as it was published before mine, I'd like to give it its due credit.  The analyses are a bit different but complement my own analyses, so it's worth taking a look.


Wednesday, September 30, 2015

2015 NFL Game Predictions: Week 4

Welcome!  I intend this to be an ongoing project of predicting NFL game outcomes, point spreads, and final scores.  My hope is that my models will improve over time as they become more sophisticated and use better data.  I will try to regularly publish predictions to keep myself accountable, and will make observations along the way about what is working and what isn't.  See below for latest updates.  Enjoy!

_____________________________________________________________________________________

Week 4: Results
The predictions and the results are below.

My predictions went 9-6.  Not great, but a little better than just flipping a coin.  What happened?  What needs to improve?  Let’s look at each game where the prediction was wrong, and see what we can find:

·         Bears vs. Raiders

o   Predicted: 24% Bears likely to Lose, but Won.

o   Bears were 0-3 and Raiders were 2-1 going into this game.  Bears won 22-20, so it was close.  Jay Cutler (QB) was back after being out the previous week.  I expect that would help the Bears.  Other sites predicted a Bears loss.

·         Bills  vs. Giants

o   Predicted 65% Bills likely to Win, but lost.

o   Bills were 2-1 and Giants were 1-2 going into the game.  Giants clearly controlled the game throughout.  The final results was 24-10, so it wasn’t close.   Both sides are pretty injured, but perhaps the Giants are more injured.  Other sites predicted a Giants win.

·         Cardinals  vs. Rams

o   Predicted:  83% Cardinals likely to Win, but lost.

o   Cardinals were 3-0 and Rams were 1-2 going into the game.  Rams led the entire game, but it was always close and finished at 24-22.  Both teams are pretty healthy, but Cardinals were missing two wide receivers and their running back.  Other sites also predicted a Cardinals win.

·         Saints  vs. Cowboys

o   Predicted Saints to lose at 32%, but they won 26-20.

o    Saints were 0-3 and Cowboys were 2-1 going into the game.  The game went into overtime.  Cowboys were pretty injured, with major starters out (QB, WR), while Saints were pretty healthy.  Other sites predicted a Saints win, so in this I disagreed.

·         Redskins  vs. Eagles

o   Predicted Redskins to lose at 48%, but they won 23-20.

o   Redskins were 1-2 and Eagles were 1-2 going into the game.  The Redskins got ahead early but the Eagles came back heavily in the third quarter.  Eagles took the lead in the 4th quarter but lost it with less than a minute to play.  Both teams have lots of injuries, but Redskins were a bit more beat up.  Other sites predicted a Redskins loss as well.

·         Steelers  vs. Ravens

o   Predicted Steelers to win at 73%, but they lost 23-20.

o   Steelers were 2-1 and Ravens were 0-3 going into the game.  The lead went back and forth and went into overtime.  Steelers were pretty injured, including starting and backup Qbs.  Ravens were also pretty injured.  Other sites predicted a Steelers loss, so in this I disagreed.

I was in agreement with other sites for 4 of these 6 games in my prediction.  Each of these games I had predicted the team with the better record to win.  Every game but one was close, and two went into overtime.  So these could have gone the other way pretty easily.  Some players were injured that weren’t injured in previous games and vice versa.  The difference in healthiness of each team seems to matter.  So going forward, it looks like I need to account for injuries in my model.  I also need less emphasis on who has the best record going into the game.  Instead, I should look at previous season records and also the strength of opponents in previous games this season.

I’ll make some adjustments and try again in a few weeks.

Week 4: First Published Predictions (Win/Lose)

I have to start somewhere, so this is where I am starting.  In alphabetical order, each team is listed with its associated next game.  Details include Home vs. Away, the Opponent, the Probability of Winning (according to my model) and the predicted result (1 for a win, 0 for a loss).  I'll analyze and comment after these games are played and the final results are in.

(Note: already I see issues.  For example, at least the Steelers vs. Ravens predictions are wrong because the Steelers starting QB is out.  Injuries to starters is something my model does not yet account for.  But it looks like it should.  Next time :) )

Team
HomeAway
Opponent
ProbabilityWin
PredictedTeamWin
ActualTeamWin
49ers
Packers
0.22
0
0
Bears
Raiders
0.24
0
1
Bengals
Chiefs
0.7
1
1
Bills
Giants
0.65
1
0
Broncos
Vikings
0.58
1
1
Browns
@
Chargers
0.5
0
0
Buccaneers
Panthers
0.24
0
0
Cardinals
Rams
0.83
1
0
Chargers
Browns
0.5
1
1
Chiefs
@
Bengals
0.3
0
0
Colts
Jaguars
0.55
1
1
Cowboys
@
Saints
0.68
1
0
Dolphins
Jets
0.3
0
0
Eagles
@
Redskins
0.52
1
0
Falcons
Texans
0.69
1
1
Giants
@
Bills
0.35
0
1
Jaguars
@
Colts
0.45
0
0
Jets
@
Dolphins
0.7
1
1
Lions
@
Seahawks
0.3
0
0
Packers
@
49ers
0.78
1
1
Panthers
@
Buccaneers
0.76
1
1
Raiders
@
Bears
0.76
1
0
Rams
@
Cardinals
0.17
0
1
Ravens
@
Steelers
0.27
0
1
Redskins
Eagles
0.48
0
1
Saints
Cowboys
0.32
0
1
Seahawks
Lions
0.7
1
1
Steelers
Ravens
0.73
1
0
Texans
@
Falcons
0.31
0
0
Vikings
@
Broncos
0.42
0
0

__________________________________________________________________________________

Wednesday, September 9, 2015

Hold'em or Fold'em: Validating a Winning Strategy

Introduction

In previous posts (here and here) I analyzed simulated hold'em poker hands to determine a winning strategy.  Bluffing aside, when should you play and when should you fold in order to have the best chances of winning?

The observations I made do not readily yield a single strategy for play.  They may sometimes conflict or be overly conservative when combined.  For example, my advice for hole cards may offer a more than 50% chance of winning on its own, but when combined with the advice on hand rankings (which also offers a better than 50% chance of winning) it may require the folding of many winning hands.

Still, we need a place to start.  Perhaps the principles I generated can be condensed, simplified, reorganized, and summed up in this way:

A Strategy

  • Hole cards
    • If your hole cards form a pair, contain an Ace, or have a rounded average rank greater than or equal to 10...
      • Continue playing
    • Else
      • Fold
  • Flop, Turn, River
    • If you have two pair 5s or better, one pair Queens or better, or three of a kind or better
      • Continue playing
    • Else
      • Fold
Will this strategy work?  Let's validate it by simulating a game against one other player.

The Program

The program remains largely the same as before, except that I have now implemented the above logic into the program.  If one folds on the hole cards, then this is tracked as "Fold - hole cards".  If one passes this test but fails on the flop, turn, or river, this is tracked as "Fold - Flop, Turn, River".  If one passes both tests, then this is tracked as "Play".

I reran 100,000 simulations of hold'em deals to Player1 and Player2.  A successful strategy will have a high percentage of Win/Play combos along with a high percentage of Lose/Fold combos.  That is, we want to play when we will win, and fold when we will lose.  If our strategy is not successful, then there will be a high percentage of Win/Fold combos (we folded when we would have won the hand) and Lose/Play combos (we played when we would have lost).

In other words, the ideal simplified scenario can be represented by the below confusion matrix:
Play
Fold
Win
50
0
Lose
0
50

In the above scenario, a win is as equally likely as a loss, so each occurs 50% of the time, adding to 100%.  However, we have predicted perfectly, so we won all the hands we have played, and lost only the hands we have folded.  Assuming we have been betting well (betting minimally with hands we will fold, betting maximally with hands we will win), the eventual result will be that we win the game and all of the money.

What does the actual confusion matrix look like?

Validation

The results of implementing this strategy are below:
Player1 Result/Action
Fold - Flop, Turn, River
Fold - hole cards
Play
Grand Total
Lose
10773
32593
4548
47914
Tie
326
3044
816
4186
Win
7158
24708
16034
47900
Grand Total
18257
60345
21398
100000


The table above gives the final result for Player1's hand (left side) and Player1's action based on the simplified principles we gave him (top).  The combinations are displayed in the middle, with row/column totals on the ends.

A simplified version of the table:
Player1 Result/Action
Fold
Play
Grand Total
Lose
43366
4548
47914
Tie
3370
816
4186
Win
31866
16034
47900
Grand Total
78602
21398
100000


Some observations:
  • As we would expect, Player1's hands lose and win about equally
  • Player1 wins about 75% of the hands he plays
  • Player1 only plays 21% of the hands
  • Of all the hands Player1 would have lost, he only plays 9% of them
  • Of all the hands Player1 would have won, he only plays 33% of them
  • 40% of Player1's folds were winning hands
  • Player1 only plays 19% of ties.

Strengths of this approach:
  • Player1 plays very few of the games he will lose
  • The strategy is simple
  • The strategy relies on information known at the time of decision

Weakness of this Approach
  • Player1 folds quite a few games in which, if he had played, he would have won
  • Player1 folds most of the games in which there is a tie (and would split the pot)
  • Player1 plays very few games

This is definitely a conservative strategy.  The result of combining the various insights we have gathered in previous posts is too cautious.  Player1 only plays when there is a great chance of winning.  Perhaps with good betting and bluffing, this can be a very effective strategy.  However, it folds a lot of winning hands, in fact, most winning hands. 

The strategy misclassifies (ignoring ties) 38% of all hands.  Counting ties (assuming you should play ties), it misclassifies 40% of all hands, that is, 40% of the time it recommends a fold when you should play and recommends that you play when you should fold.

Is there a better way?  Most certainly.  Let's use machine learning to analyze our data and come up with a more effective model.

Machine Learning: Decision Tree

I use a decision tree to develop a model for hold'em strategy because it is easy to understand the decision paths.  Here is a plot of the model along with the associated splits and ratios of classification:


The details may be difficult to see, so here is the decision tree strategy with words:
  • Flop, Turn, River
    • If Player1 has two pair or better
      • Play
    • Else (Player1 has one pair or high card)
      • If Player1 has a high card hand
        • Fold
      • Else (if Player1 has one pair)
        • If both of the cards that make up the one pair are in the community cards
          • Fold
        • Else (if only 0 or 1 of the cards that make up the one pair are in the community cards)
          • Play

This model has only 27% misclassification, that is, it predicts a loss when you really win or predicts a win when you really lose, about 27% of the time.  The confusion matrix is below for play/fold and win/lose/tie combinations:

Player1 Result/Action
Fold
Play
Grand Total
Lose
29591
18323
47914
Tie
1452
2734
4186
Win
7429
40471
47900
Grand Total
38472
61528
100000


Some observations:
  • Player1 wins about 66% of the hands he plays
  • Player1 plays 62% of the hands
  • Of all the hands Player1 would have lost, he plays 39% of them
  • Of all the hands Player1 would have won, he plays 84% of them
  • Only 19% of Player1's folds were winning hands
  • Player1 plays 65% of ties.

Strengths of this approach:
  • Most folds are losses; most plays are wins
  • The strategy is simple

Weakness of this Approach
  • The strategy relies on information not known at time of decision (at least before flop)
  • Player1 plays too many hands (in particular, too many losing hands)
This strategy is much more effective.  However, it offers no guidance for the hole cards, recommending that one should always play at least through the flop.

Do the hole cards really matter in an overall strategy?  Looking at another decision tree using only the hole card information (max rank, min rank, average rank, pair (yes/no)) reveals that, at best, the model will still misclassify about 43% of the time.  A simple split based on the average rank of the hole cards being >= 7.5 yields only a slight advantage in winning (54%) and correctly classifies only 45% of the time. 

If we force the previous decision to use the hole card information to its full extent, the model becomes incredibly complex (over 1000 nodes) and only improves to about 26% misclassification.  The decision tree looks like this:


Clearly, this isn't helpful.  But we know hole cards are important to some degree, so shouldn't this count for something?  In addition, this strategy plays too many hands, and as a result, plays too many losing hands.

A Compromise


What should we do now?  If we compare the first strategy, we see that the major problem is that one folds too much, particularly, on hands that would have been won (the lower left corner green box).  It plays too little.  In contrast, the decision tree model plays too much, in particular, it plays too many hands that it will lose (the upper right yellow box).

Is there a way to combine both strategies in a way that is more effective than either, is still simple, plays about 50% of the time, and provides more guidance at each stage of the game?  I combined both approaches and played with the logic until coming up with a more balanced strategy:
  • Hole Cards
    • If the rounded average rank of the hole cards is >= 6 or the hole cards form a pair
      • Continue Playing
    • Else
      • Fold
  • Flop, Turn, River
    • If you have two pair or better
      • Continue Playing
    • Else (one pair or high card)
      • If one pair, only 0 or 1 of the cards that make up the one pair are in the community cards, and the pair is 5s or better
        • Continue playing
      • Else (high card, one pair of 4s or worse, or one pair with both pair cards in the community)
        • Fold
The confusion matrix is as follows (I validated the approach against a test set and the results were virtually the same):

Player1 Result/Action
Fold
Play
Grand Total
Lose
35010
12904
47914
Tie
2005
2181
4186
Win
13500
34400
47900
Grand Total
50515
49485
100000


Some observations:
  • Player1 wins about 70% of the hands he plays
  • Player1 plays 49% of the hands
  • Of all the hands Player1 would have lost, he only plays 27% of them
  • Of all the hands Player1 would have won, he plays 72% of them
  • 26% of Player1's folds were winning hands
  • Player1 plays 52% of ties.
  • The strategy misclassifies 28% of the time.

Strengths of this approach:
  • Most plays are wins; most folds are losses
  • The strategy is still fairly simple
  • The strategy relies more on information known at the time of decision
  • Player1 plays about half the time
  • The misclassification is low.

This approach does not suffer the weakness of the other two approaches, but represents a balanced compromise between them. While the initial strategy is too conservative, the decision tree strategy is too liberal.  This compromise still has good predictive power, is simple, and useful, and represents a middle ground strategy.

Conclusion

As the foregoing shows, there is no single master strategy for winning at poker.  Any strategy will have strengths and weaknesses.  And different strategies may, for this reason, appeal to different people.  What I have shown above are some data driven strategies designed to maximize strengths and minimize weaknesses, but how they do so differs.  Feel free to choose the strategy (or modified suitably) that appeals to you.

This concludes my analysis of poker hands.  For now at least....

Good luck!