While the final version of the project is located here (https://github.com/wwells/CUNY_DATA_620_GROUP), I have copied the relevant portions for the below to my own GitHub repository here (https://github.com/anrcarson/CUNY-MSDA/tree/master/DATA620/DATA_620_Group_Final) for long term stability.
The goal of the project was to use NLP and social network analysis methods to find interesting patterns and relationships within the scripts of Seinfeld episodes and the associated metadata. My portion of the project focused on social network analysis of the cast, characters, directors, and writers in the show.
The code for my part is located here (https://github.com/anrcarson/CUNY-MSDA/blob/master/DATA620/DATA_620_Group_Final/Seinfeld_SNA.ipynb). As the ipynb files are having trouble rendering in GitHub, I have copied and pasted the interesting portions below. See the code files for complete details and code used. Videos giving an overview of the project are also located in the main GitHub folder for the final project.
--------------------------------------------------------------------------------------------------------------
What does Seinfeld look like when analyzed using social networks? What are the relationships between cast, characters, directors, and writers like? How do these change over the seasons? This will be explored below.
Analysis Summary
- SNA of Actors / Characters by Season
- SNA of Character by Scene Number (scenes together)
- SNA of Directors by Season
- SNA of Writers by Season
- SNA of writers, directors, and cast
Read In Data
Pull in pre-processed and cleaned data from GitHub. There is data about the:
- actor/character and season/episode (SEID)
- dialogue by Character, SEID, and scene, and a subset of this data to exclude one-offs
- director and SEID
- writers and SEID
We will use this data for our analysis.
Data sets:
Cast:

Dialogue:

Metadata:

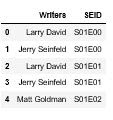
Writers:

1. Actor / Character and Season
We start with the actor/character and season.
For those unfamiliar with the show, Seinfeld is a "show about nothing" revolving around Jerry Seinfeld, George Costanza, Elaine Benes, and (Cosmo) Kramer. Each show usually focuses on a particular daily life annoyance that we all experience but rarely talk about (e.g., waiting for a reservation). Other important characters are Newman (Kramer's friend and a sort of nemesis to Jerry), Susan Biddle Ross (George's wife), Estelle and Frank Costanza (George's parents) , J Peterman (Elaine's eccentric boss), Morty and Helen Seinfeld (Jerry's parents), and Uncle Leo (Jerry's uncle).
Many guests come and go. According to the below grouped count, there were 1280 total Actor/Characters on the show.

A graph on characters and season produces a large graph that appears to have some structure, but cannot be discerned in its current form. We break it apart for more insight.

Projected Graph: Actor to Season
First, let's project the actor using the season value
We see that George, Jerry, Elaine, and Kramer are central to the network, as we would expect. Other important characters are Newman, Jerry's parents and Jerry's Uncle Leo, and George's parents.
Number of Nodes:
1158
Number of Edges:
120325
Degree:
[('Jason Alexander', 1157), ('Jerry Seinfeld', 1157), ('Julia Louis-Dreyfus', 1157), ('Michael Richards', 1157), ('Wayne Knight', 1092), ('Liz Sheridan', 1055), ('Len Lesser', 1035), ('Barney Martin', 985), ('Estelle Harris', 985), ('Jerry Stiller', 985)]
Closeness:
[('Jason Alexander', 1.0), ('Jerry Seinfeld', 1.0), ('Julia Louis-Dreyfus', 1.0), ('Michael Richards', 1.0), ('Wayne Knight', 0.9468085106382979), ('Liz Sheridan', 0.9189833200953137), ('Len Lesser', 0.9046129788897577), ('Barney Martin', 0.8705793829947329), ('Estelle Harris', 0.8705793829947329), ('Jerry Stiller', 0.8705793829947329)]
Betweenness:
[('Jason Alexander', 0.056323838548247226), ('Jerry Seinfeld', 0.056323838548247226), ('Julia Louis-Dreyfus', 0.056323838548247226), ('Michael Richards', 0.056323838548247226), ('Wayne Knight', 0.04254707389386355), ('Liz Sheridan', 0.040616403262133595), ('Len Lesser', 0.035426396987549555), ('Barney Martin', 0.027383543036812213), ('Estelle Harris', 0.027383543036812213), ('Jerry Stiller', 0.027383543036812213)]
Eigenvector:
[('Jason Alexander', 0.10680557493057559), ('Michael Richards', 0.10680557493057559), ('Jerry Seinfeld', 0.10680557493057558), ('Julia Louis-Dreyfus', 0.10680557493057558), ('Wayne Knight', 0.10586072702106807), ('Liz Sheridan', 0.10382121280099006), ('Len Lesser', 0.10359967554620415), ('Barney Martin', 0.10269970147289105), ('Estelle Harris', 0.10269970147289105), ('Jerry Stiller', 0.10269970147289105)]
Pagerank:
[('Jerry Seinfeld', 0.0051714699469767225), ('Jason Alexander', 0.005171469946976721), ('Julia Louis-Dreyfus', 0.005171469946976721), ('Michael Richards', 0.005171469946976721), ('Liz Sheridan', 0.004600957307622559), ('Wayne Knight', 0.004544137955759714), ('Len Lesser', 0.00435177108591984), ('Barney Martin', 0.003973489068235779), ('Estelle Harris', 0.003973489068235779), ('Jerry Stiller', 0.003973489068235779)]
Projected Graph: Season
There were 9 total seasons. Based on the actors, there is a strong relationship between seasons 6, 7, 8, and 9, and to a lesser extent, 5. Other seasons are more disconnected, particularly season 1, which has relatively weak links to the other seasons.Number of Nodes:
9
Number of Edges:
36
Degree:
[('S01', 8), ('S02', 8), ('S03', 8), ('S04', 8), ('S05', 8), ('S06', 8), ('S07', 8), ('S08', 8), ('S09', 8)]
Closeness:
[('S01', 1.0), ('S02', 1.0), ('S03', 1.0), ('S04', 1.0), ('S05', 1.0), ('S06', 1.0), ('S07', 1.0), ('S08', 1.0), ('S09', 1.0)]
Betweenness:
[('S01', 0.0), ('S02', 0.0), ('S03', 0.0), ('S04', 0.0), ('S05', 0.0), ('S06', 0.0), ('S07', 0.0), ('S08', 0.0), ('S09', 0.0)]
Eigenvector:
[('S01', 0.33333333333333337), ('S02', 0.33333333333333337), ('S03', 0.33333333333333337), ('S04', 0.33333333333333337), ('S05', 0.33333333333333337), ('S06', 0.33333333333333337), ('S07', 0.33333333333333337), ('S08', 0.33333333333333337), ('S09', 0.33333333333333337)]
Pagerank:
[('S08', 0.1434942043226922), ('S07', 0.1318409095299596), ('S06', 0.13082253911668065), ('S09', 0.13079574454678747), ('S05', 0.12284040304997577), ('S04', 0.1159864868159047), ('S03', 0.08670297886058641), ('S02', 0.07946020473082635), ('S01', 0.05805652902658701)]

Island Method
Let's pair down each of the projected graphs using the island method to get a better look.An edge weight greater than 1 takes the character network down from 1158 nodes to 123. As the weights increase, we see the central characters are in fact central to the network.


In the end, we are left with the four main characters.
Now let's look at season.
The seasons are reduced from 9 to 8, 6, 5, and 3. As observed above, seasons 6, 7, 8, and 9 are strongly related and are at the center of the network.

2. Character by Scene Number
Now let's look at the relationship among characters by the scenes they share together.We see below that there are some character/scenes that are not connected to anything else. These are probably passing or transitional scenes.
As this graph is hard to see in detail, let's allow for more detailed exploration.

Below one can explore any scene from any episode and any season and look at the network based on characters in that scene. As scenes can be very short, this is done at the episode level as well.
As an example of detailed exploration, below are networks of a scene from the finale and the finale as a whole using functions that were defined previously.


Projected Graph: Character to Scene
As the above full graph is difficult to interpret in whole, let's project using character. Below we see that (as we expect), Jery, George, Elaine, and Kramer are central. Newman is also central as Jerry's parents, George's wife, and George's dad. Also central are "woman" and "man", probably passing characters that do not refer to the same woman or man, but these types of characters occur enough and are grouped together to show up here.Number of Nodes:
1247
Number of Edges:
5493
Degree:
[('JERRY', 790), ('GEORGE', 693), ('ELAINE', 655), ('KRAMER', 607), ('JERRY ', 91), ('NEWMAN', 84), ('WOMAN', 84), ('MAN', 79), ('MORTY', 74), ('SUSAN', 74)]
Closeness:
[('JERRY', 0.7200000786831586), ('GEORGE', 0.6788215646510195), ('ELAINE', 0.6638644793282006), ('KRAMER', 0.6459813790054507), ('JERRY ', 0.4995918913311714), ('NEWMAN', 0.4989554685396666), ('WOMAN', 0.4981094228109007), ('MORTY', 0.49684572025831497), ('GEORGE ', 0.495797522536251), ('FRANK', 0.49517072415124946)]
Betweenness:
[('JERRY', 0.29695338734359367), ('GEORGE', 0.2792132762253886), ('ELAINE', 0.22483592424865878), ('KRAMER', 0.20049918848202178), ('NEWMAN', 0.006965499433055013), ('MORTY', 0.006542993944841277), ('JERRY ', 0.0061408950101195054), ('MAN', 0.005991448766686579), ('ELAINE ', 0.005034094293925), ('GEORGE ', 0.00468205121023861)]
Eigenvector:
[('JERRY', 0.38101457433569225), ('GEORGE', 0.3321655169514927), ('ELAINE', 0.3277372511815577), ('KRAMER', 0.30690595882902166), ('WOMAN', 0.07859139462881744), ('JERRY ', 0.07664033194405434), ('NEWMAN', 0.07163994655449737), ('SUSAN', 0.06969880915701644), ('MAN', 0.06793238704933884), ('FRANK', 0.06635536477257721)]
Pagerank:
[('JERRY', 0.13246755420994547), ('GEORGE', 0.10847747475931253), ('ELAINE', 0.09705337367531358), ('KRAMER', 0.09126011465460084), ('NEWMAN', 0.009791730631230662), ('JERRY ', 0.008522064914054085), ('MORTY', 0.008373384814056277), ('HELEN', 0.007102991327363675), ('FRANK', 0.006777786438202993), ('ELAINE ', 0.006632817748910791)]

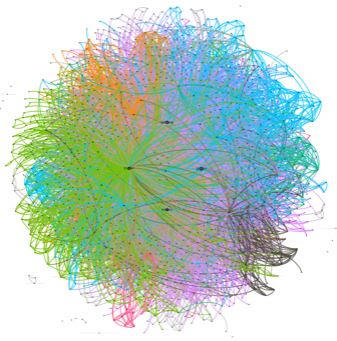
Here is the above graph visualized in Gephi. The cenral four nodes are (no surprise) Jerry, George, Elaine, and Kramer.

Island
Let's use the island method to reduce the noise. The first thresholding reduces from 1247 nodes to 551, and the second reduces that to 4 (our four main chracters). Clearly, there are lots of characters in the show, but they are mostly fleeting, passing, and revolve around a relationship to Jerry, George, Elaine, and Kramer. The strongest relationship is between Jerry and George.
3. Directors and Season
How do the directors and seasons relate?We see two distinct groups. The first is a larger group around seasons 1-5. The second group is much smaller around seasons 6-9. While there were 5 directors in the first five seasons, there were only two different directors in 6-9. This helps explain why 6-9 are grouped much more closely together in the actor/character to season analysis. This is made even more obvious in the below projected graphs.

Number of Nodes:
7
Number of Edges:
8
Degree:
[('Tom Cherones', 4), ('David Steinberg', 3), ('Jason Alexander', 3), ('Joshua White', 3), ('Andy Ackerman', 1), ('Art Wolff', 1), ('David Owen Trainor', 1)]
Closeness:
[('Tom Cherones', 0.6666666666666666), ('David Steinberg', 0.5333333333333333), ('Jason Alexander', 0.5333333333333333), ('Joshua White', 0.5333333333333333), ('Art Wolff', 0.38095238095238093), ('Andy Ackerman', 0.16666666666666666), ('David Owen Trainor', 0.16666666666666666)]
Betweenness:
[('Tom Cherones', 0.2), ('Andy Ackerman', 0.0), ('Art Wolff', 0.0), ('David Owen Trainor', 0.0), ('David Steinberg', 0.0), ('Jason Alexander', 0.0), ('Joshua White', 0.0)]
Eigenvector:
[('Tom Cherones', 0.5235630239710829), ('David Steinberg', 0.48204443864828317), ('Jason Alexander', 0.48204443864828317), ('Joshua White', 0.48204443864828317), ('Art Wolff', 0.1696503387049744), ('Andy Ackerman', 2.4826834530544244e-06), ('David Owen Trainor', 2.4826834530544244e-06)]
Pagerank:
[('Tom Cherones', 0.20289637934863064), ('David Steinberg', 0.14894828459348708), ('Jason Alexander', 0.14894828459348708), ('Joshua White', 0.14894828459348708), ('Andy Ackerman', 0.14285714285714285), ('David Owen Trainor', 0.14285714285714285), ('Art Wolff', 0.0645444811566223)]

Number of Nodes:
9
Number of Edges:
16
Degree:
[(1, 4), (2, 4), (3, 4), (4, 4), (5, 4), (6, 3), (7, 3), (8, 3), (9, 3)]
Closeness:
[(1, 0.5), (2, 0.5), (3, 0.5), (4, 0.5), (5, 0.5), (6, 0.375), (7, 0.375), (8, 0.375), (9, 0.375)]
Betweenness:
[(1, 0.0), (2, 0.0), (3, 0.0), (4, 0.0), (5, 0.0), (6, 0.0), (7, 0.0), (8, 0.0), (9, 0.0)]
Eigenvector:
[(1, 0.4472135954430211), (2, 0.4472135954430211), (3, 0.4472135954430211), (4, 0.4472135954430211), (5, 0.4472135954430211), (6, 7.978557153034853e-06), (7, 7.978557153034853e-06), (8, 7.978557153034853e-06), (9, 7.978557153034853e-06)]
Pagerank:
[(6, 0.12489850979595186), (8, 0.12489850979595185), (1, 0.1111111111111111), (2, 0.1111111111111111), (3, 0.1111111111111111), (4, 0.1111111111111111), (5, 0.1111111111111111), (7, 0.09732371242627035), (9, 0.09732371242627033)]

4. Writers and Season
What about writers and season?Unlike the directors, the writers/season graph form one cluster, and there are many more writers than directors.

The four main writers are: Larry David (who originated the show with Jerry), Jerry Seinfeld, Peter Mehlman, and Andy Robin. Peter Mehlman and Larry David are the most central writers in the network.

Looking at writers to season, we again see that seasons 6-9 form a strong link based on writers. As we would expect the writers to have large control over which characters/actors show up, it shouldn't surprise us that having the same writers in 6-9 tends towards having the same characters in 6-9.

5. Writers, Directors, and Cast
Finally, let's look at the relationship between writers, directors, and cast directly using the SEID to join.
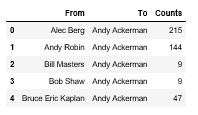
While the first graph below is a little difficult to read, by increasing the counts threshold, we can see that the strongest director-writer relationship exists between Tom Cherones and Larry David. This is interesting as Tom Cherones only directed in seasons 1-5. However, Andy Ackerman (6-9) has a strong relationship with several writers, including Larry David.


Now let's look at writer and cast. The first few graphs produce an un-interpretable mess.

After increasing the counts threshold, we can see some insights coming out of the noise. In particular, we see that the main writer (Larry David), along with Peter Mehlman and Larry Charles, are strongly related to the four main characters. Again, this is not surprising as the main writers should be related to the main characters.

Now we look at the relationship between director and cast.


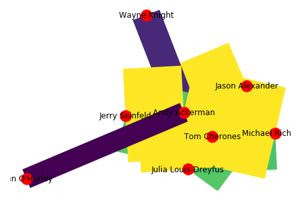
We see that central directors Tom Cherones and Andy Ackerman are connected to the four main characters strongly. Other important characters J Peterman, Newman, Susan, Jerry's parents, and George's parents. Again, not surprising.

These relationships are made more obvious by using projections.
For directors (using writers), Andy Ackerman and Tom Cherones have the strongest relationship.

For writers (on directors), Larry David and Andy Robin are most central.
Number of Nodes:
39
Number of Edges:
503
Degree:
[('Larry David', 38), ('Andy Robin', 37), ('Bill Masters', 37), ('Bruce Kirschbaum', 37), ('Carol Leifer', 37), ('Jerry Seinfeld', 37), ('Max Pross', 37), ('Peter Mehlman', 37), ('Tom Gammill', 37), ('Bob Shaw', 27)]
Closeness:
[('Larry David', 1.0), ('Andy Robin', 0.9743589743589743), ('Bill Masters', 0.9743589743589743), ('Bruce Kirschbaum', 0.9743589743589743), ('Carol Leifer', 0.9743589743589743), ('Jerry Seinfeld', 0.9743589743589743), ('Max Pross', 0.9743589743589743), ('Peter Mehlman', 0.9743589743589743), ('Tom Gammill', 0.9743589743589743), ('Bob Shaw', 0.7755102040816326)]
Betweenness:
[('Larry David', 0.05465465465465468), ('Andy Robin', 0.031657973763236945), ('Bill Masters', 0.031657973763236945), ('Bruce Kirschbaum', 0.031657973763236945), ('Carol Leifer', 0.031657973763236945), ('Jerry Seinfeld', 0.031657973763236945), ('Max Pross', 0.031657973763236945), ('Peter Mehlman', 0.031657973763236945), ('Tom Gammill', 0.031657973763236945), ('Bob Shaw', 0.01744902797534377)]
Eigenvector:
[('Larry David', 0.21030975623673595), ('Andy Robin', 0.2096838595527111), ('Bill Masters', 0.2096838595527111), ('Bruce Kirschbaum', 0.2096838595527111), ('Carol Leifer', 0.2096838595527111), ('Jerry Seinfeld', 0.2096838595527111), ('Max Pross', 0.2096838595527111), ('Peter Mehlman', 0.2096838595527111), ('Tom Gammill', 0.2096838595527111), ('Bob Shaw', 0.16677389157526631)]
Pagerank:
[('Larry David', 0.04290513400304048), ('Andy Robin', 0.04105116362562973), ('Carol Leifer', 0.04105116362562973), ('Jerry Seinfeld', 0.03953773990716651), ('Bruce Kirschbaum', 0.038789268664957834), ('Bill Masters', 0.03878926866495783), ('Max Pross', 0.03878926866495783), ('Peter Mehlman', 0.03878926866495783), ('Tom Gammill', 0.03878926866495783), ('Bob Shaw', 0.026201129486917826)]
For cast (on writer), we see two distinct groups.

Finally, let's combine writers, directors, and cast into a single graph.

As this is difficult to see, We put it into Gephi for better visualization.


