Thursday, October 29, 2015

2015 NFL Game Predictions: Week 8

Welcome!  I intend this to be an ongoing project of predicting NFL game outcomes, point spreads, and final scores.  My hope is that my models will improve over time as they become more sophisticated and use better data.  I will try to regularly publish predictions to keep myself accountable, and will make observations along the way about what is working and what isn't.  See below for latest updates.  Enjoy!
Previous predictions
_____________________________________________________________________________________
Recap of Week 8:
My most recent attempt wasn’t great.  My predictions went 8-6.  Let’s look at what happened:
·         49ers vs. Rams
o   Predicted: 49ers 64% likely to win, but they lost.
o   Other sites predicted a Ram’s victory.  I should have agreed.  49ers have been struggling and had the worst of the two records going into the game.  Kaepernick is getting benched and Vernon Davis has been traded, so things are looking really grim for the 49ers going forward.  No real injuries I see, so my prediction was just bad.  Especially since the 49ers got trounced.
·         Packers vs. Broncos
o   Predicted: 64% Packers likely to win, but they lost.
o   Other sites also favored the Packers.  Packers didn’t have any new major injuries.  Again, it looks like another missed prediction, although this time I was on the side of other predictions.  Unfortunately, the game wasn’t even close.
·         Falcons vs. Buccaneers
o   Predicted: 65% Falcons likely to win, but they lost.
o   This game went into overtime, and other sites thought the Falcons would win too, so I don’t feel too bad.  Falcons had a much stronger record and were playing at home.  I’ll call this one unlucky.
·         Lions vs. Chiefs
o   Predicted: 55% Lions likely to beat Chiefs, but they lost.
o   Other sites favored the Chiefs, but not by much.  Both teams had pretty bad records, but the Lions were worse.  Lions got destroyed 45 to 10.  Lions were a bit healthier than in previous games.  Another bad prediction on my part.
·         Jets vs. Raiders
o   Predicted: Jets 53% likely to win, but they lost.
o   Other sites favored the Jets, and they had a slightly better record going into the game.  Jets have a lot of injuries on their offense, including their QB.  Raiders look comparatively healthy, so perhaps this can help explain some of the error in prediction (my model does not yet account for injuries/starters).
·         Titans vs. Texans
o   Predicted: Titans 56% likely to win, but they lose.
o   Texans were favored to win by other sites and they had a slightly better record going into the game.  Texans look more injured than Titans.  So again, another bad call on my part.
I was in agreement with other sites on 3 of these 6 games.  It looks like injuries are partly making a difference, but not by much.  I think in the end, I need better data and a more accurate model as some of my predictions weren’t even close.  We’ll try again soon.
Week 8: Second Published Predictions (Win/Lose)
Below is the next round of predictions I was able to make.  I've been working on cleaning up the code, automating data pulls, creating new features, and making sure I wasn't using any information that was not known prior to the game in building my model.  Here are the predictions for week 8:
Week
Date
Team
HomeAway
Opponent
ProbabilityWin
PredictedTeamWin
ActualTeamWin
8
10/29/2015
Dolphins
@
Patriots
0.28
0
0
8
10/29/2015
Patriots
Dolphins
0.72
1
1
8
11/1/2015
49ers
@
Rams
0.64
1
0
8
11/1/2015
Bears
Vikings
0.31
0
0
8
11/1/2015
Bengals
@
Steelers
0.62
1
1
8
11/1/2015
Broncos
Packers
0.36
0
1
8
11/1/2015
Browns
Cardinals
0.34
0
0
8
11/1/2015
Buccaneers
@
Falcons
0.35
0
1
8
11/1/2015
Cardinals
@
Browns
0.66
1
1
8
11/1/2015
Chargers
@
Ravens
0.38
0
0
8
11/1/2015
Chiefs
Lions
0.45
0
1
8
11/1/2015
Cowboys
Seahawks
0.44
0
0
8
11/1/2015
Falcons
Buccaneers
0.65
1
0
8
11/1/2015
Giants
@
Saints
0.41
0
0
8
11/1/2015
Jets
@
Raiders
0.53
1
0
8
11/1/2015
Lions
@
Chiefs
0.55
1
0
8
11/1/2015
Packers
@
Broncos
0.64
1
0
8
11/1/2015
Raiders
Jets
0.47
0
1
8
11/1/2015
Rams
49ers
0.37
0
1
8
11/1/2015
Ravens
Chargers
0.62
1
1
8
11/1/2015
Saints
Giants
0.59
1
1
8
11/1/2015
Seahawks
@
Cowboys
0.56
1
1
8
11/1/2015
Steelers
Bengals
0.37
0
0
8
11/1/2015
Texans
Titans
0.44
0
1
8
11/1/2015
Titans
@
Texans
0.56
1
0
8
11/1/2015
Vikings
@
Bears
0.69
1
1
8
11/2/2015
Colts
@
Panthers
0.34
0
0
8
11/2/2015
Panthers
Colts
0.66
1
1
_____________________________________________________________________________________

Friday, October 16, 2015

Take You Out, Coach: Why NFL Coaches Get Sacked

Introduction

While I am continuing to gather more data for predicting NFL game outcomes, I am exploring the data I gather for insights and interesting facts.  My most recent exploration comes from looking at yearly team data with the coach included for each year.  From that I can determine how long a coach has been on that same team, if there was a coaching change, and what impact a coaching change has.  I can also gain some insight as to why a coach is fired.  Here are some things I discovered.

Random Facts about Coaches

  • Most years coaching for a single team in a row?
    • 29 years by Landry of the Dallas Cowboys, 1960 -1988 and Lambeau for the Packers 1921-1949.  Others: Shula (26, Dolphins), Owen (23, Giants), and Noll (23, Steelers)
    • Current coaches: Belichick (16, Patriots), Lewis (13, Bengals), and Coughlin (12, Giants)
  • Most years coaching for a single team:
    • 39 years for Halas for the Bears.  From 1920-1929, 1933-1941, 1946-1955,1958-1967
  • Average years of coaching for a single team: 4 years (median of 3)


    • Most coaches only get 2 years, but 1 year is closely behind
  • Most wins: Shula (346), Halas (313), Landry (250)
  • Most losses: Shula (202), Landry (162), Reeves (155)
  • Highest overall win ratio by a retired coach over more than a single season: Madden (.72)
    • Current coach over more than one season: Arians (.70), McCarthy(.68), and Belichick (.67)
  • Most teams coached for (depends on how you count it, but...):
    •  Phillips (5), Edwards, Johnson, Mora, Parcells, Ryan, Saban, Schottenheimer, Turner (4)
  • Most playoff appearances:
    • Shula (19), Landry (18), Brown (15), Belichick (13), Schottenheimer (13)
  • Most years since playoffs with the same coach:
    • Halas (8), Lambeau (7), Parker (7), Wilson (7), Starr (6)
  • Most years since playoffs by any team:
    • The Cardinals were out of the playoffs for 25 years straight from 1949-1973.  The Redskins were also out for 25 years from 1946-1970.
    • Current: Bills (16), Browns (13), and Raiders (13)

Coaching Changes and Win Ratio

Does a coaching change make a difference in the following year?  If we look at the Win Ratio (wins/(wins+losses+ties)), the win ratio in years where there is no coach change (i.e., the same coach as previous year) is higher on average than years where there is a coach change (i.e., a different coach from previous year).  No coach change years have an average win ratio of .53 while coach change years have an average of .40.  The graph of the distribution is below.


But perhaps it is lower because the previous coach was doing such a poor job, and so the new coach has a bad team to start with and needs time to rebuild.  We can compare the win ratio of coaches on their last year with those in their first year (i.e., a coach change), and we find out that they are virtually the same.  Coaches in their last year have a slightly lower win ratio (.38), but the distribution looks basically the same:
In fact, if we look at coaches who are not in their first year or in their last year, these coaches have an average win ratio of .57.  The distribution is below:
So what we might expect is that a coach will do fairly poorly his first year as he rebuilds a broken team, he will do better in his middle years, but as his win ratio declines, he is headed for his last year as a coach for the particular team.  That is, after a grace period, a coach's continued employment depends on the win ratio.  This seems reasonable.  But here is what that journey looks like, plotting the win ratio for every coach/team combo over the duration of that coach's time with the team (duration is calculated by year of coaching for the team divided by total years of coaching for the team):
There is no pattern here.  In fact, win ratio appears to have nothing to do with a coach's duration.  But perhaps the average win ratio for each duration follows the pattern we would expect.  In fact, there is a broad trend of rising and then falling of the average win ratio through the tenure of all coaches as a group:

However, for any given individual coach, this trend may not be followed perfectly.  Here are some examples:

Some coaches finish their last year coaching with a decent win ratio, and as we have seen there is a lot of variation.  So while it is an important part of the reason why a coach may be let go, it is not the only reason. 

Why Do Coaches Get Fired (or Retire or ...)

Most coaches do not get fired (or retire) each year.  Over the history of the NFL, a coach has been in his last continuous year of coaching for the same team about 27% of all year/team/coach combinations.  If trying to predict if a coach will be coaching his last year, one could simply predict for all year/team/coach combinations that he will not be coaching his last year, and one would be correct 73% of the time.  Obviously, this is not helpful if we are trying to predict when a coach will be fired/retired, since all of these predictions will be wrong.  So the success of model in this instance is how well it predicts the firing/retiring of a coach specifically.
Coaches are likely fired/retired for many reasons not directly observable to the public: administrative conflicts, new opportunities, actual retirement, family reasons...  Such things are not readily known and as a result cannot be included in a model.  What is known (and what I will be focusing on) is each coach's football stats with his team prior to his firing/retiring.  In particular:
  • Wins, Losses, Ties, Win Ratio Previous years win ratio comparison
  • Made Playoffs that year, Years since playoffs with that coach
  • Team ranks (offensive, defensive, overall)
  • Years Coaching
These factors are easily measurable, publicly measurable, and intuitively important in whether a coach is fired/retired.  According to my models, here are the important factors and some comments on them:
  • Win Ratio:
    • Having a 0.50+ win ratio strongly indicates that the coach will NOT be fired/retired, although it is not perfect.
  • Point Difference (points for - points against)
    • A negative point difference likely means the coach will be fired/retired, unless he has better than average points for.  If that is the case, then what seems to matter is the current win ratio compared to previous years. 
    • If the coach does not have better than average points for and has a negative point difference, the coach will likely be fired/retired.
  • Win Ratio Differences
    • If  there has been a 30% drop in win ratio over the past three years, then the coach will most likely be fired/retired.
    • If not,  and the coach has appeared to have peaked already in win ratio, then its a toss up whether the coach will keep his job or not.
    • Drops in win ratio from two years prior and also the previous year indicate the coach is likely to be fired/retired.
  • Wins
    • Having more than 10 wins suggests the coach will NOT be fired/retired, although it is not perfect.
  • Years Coaching
    • If a coach has a win ratio less than 0.50, and has only coached one year, he is more likely to be fired/retired than not, but only slightly.  Surviving at least two years greatly improves his changes of not being fired.  In fact, the more years you coach, the less likely you are to be fired/retired.
  • Offensive Rank
    • With a losing record in the season, a coach can still keep his job if his team's offensive rank by points is in the top 6 (i.e., 1-6).  In one model, each decrease (e.g., 7 to 8) in offensive rank increased the coach's chances of firing by 3%.
  • Years Since Playoffs with Same Coach
    • In some models, this really mattered.  In one, for every year not going to the playoffs, the coach's chances of being fired/retired increased by about 15%.  The longer the coach is out of the playoffs with his team, the more likely he will be fired.
    • Although a bit unfair, a team's being out of the playoffs for a long time increases a coach's chances of being fired, even when that coach was not responsible for the long drought that preceded him.


In summary, a coach will likely be fired/retired if some combination of the following factors is present in any given year: a win ratio of less than 50%, a declining win ratio from previous years, a low scoring offense, more points against than for, fewer years coaching for the team, and several years since a playoff appearance.

Who Has to Worry in 2015?

Based on the above considerations and modeling, who should be most worried in 2015 with the way things are at present?  I would have said Philbin of the Dolphins, but he already got fired.  After him, I believe Payton and Tomsula have the most to be worried about:
  • Payton (Saints)
    • The Saints had a bad year last year and this year doesn't look any better, although the recent win against the Falcons may bring hope.  Nevertheless, the best seems to be in the past for Payton, at least as far as his time with the Saints is concerned.  I rate him as 75% likely to be fired/retired.
  • Tomsula (49ers)
    • The 49ers are off to a really bad start.  They didn't make the playoffs last year, and this year is not looking good either.  While it is Tomsula's first year, that may make it harder to keep his job if he can't turn things around soon.  I rate him as 75% likely to be fired/retired.
Others that may have reason to worry: Harbaugh (Ravens), Garrett (Cowboys), Caldwell (Lions), and McCoy (Chargers).


Conclusion

 It is not surprising that coaches are largely fired because they have started losing and are not going to the playoffs.  What is slightly surprising is that the longer a coach is coaching, the more likely he is to continue coaching.  I suppose that past success can help sustain a coach into the future, at least for a while.  Also a bit surprising initially but not after reflection, is the fact that, even though the team has a losing record, as long as the team is putting up lots of points, the coach will likely be retained.  After all, what do fans want to see?  Wins, playoffs, and lots of points being scored by their team.  A great defense is necessary to win championships, but it is not as glamourous or as fun to watch as a great offense.

Good luck in week 6!


Friday, October 2, 2015

A Brief History of Kicking: NFL 1976-2014


Introduction

While gathering data for developing predictive models for NFL game results (see here), I have been looking into general statistics about NFL games and players.  Here is a look into the history and statistics of kicking and punting in the NFL since 1976.

The Dataset

I gathered the Kicking tables for each NFL team for each year from 1976 -2014.  Included is a record for every player that kicked a field goal or extra point, or who did a punt.  The fields included Age, Position, field goal attempts and field goals made for 0-19, 20-29, 30-29, 40-49, and 50+ yard categories.  Also included were extra points attempted and made, punt counts, punt yards, longest punts, blocked punts, and yards per punt.  There were 2,923 such records.  Below are some "random" facts.
  • Player Number
    • The most popular Kicker or Punter player number is 4.
    • 78% of Kickers or Punters have a player number between 0 and 10; 20% between 11 and 19; 2% between 20 and 90.
  • Age
    • Most common age of Punters and Kickers is 24
    • Youngest Punter/Kicker was 22;  oldest was 47
      • Oldest: Morten Andersen, kicker for Falcons through 2007.  He started his career in 1982 at age 22 as a kicker for the Saints.
    • As we would expect, the amount of players per age decreases as age increases:
  • Position
    • Most punts/fields goals are performed by punters and kickers.  However, 43 records were QBs, and many others were WRs, FBs, and practically every other position at least once.
      • The last QBs to punt were Ben Roethlisberger and Tom Brady in 2013.  Tom outkicked Ben 32 yards to 28 yards.
      • Chris Miller of the 1989 Falcons, a QB, kicked and made a field goal.  He is the only QB to do so (in this dataset).
      • Tony Galbreath, a fullback in 1979 for the Saints, made 2 of 3 field goals.
      • Brian Sipe, Dan Pastorini, Pat Ryan, and Rick Neuheisel, all QBs, each has attempted an extra point.  All made it except for Dan Pastorini.
      • Danny White played as a QB and punter for the Cowboys in the early 1980s. 
      • Ted Thompson, a linebacker for the Oilers in 1980, made all 4 of his extra points.

Fields Goals Over Time

How have field goal attempts, mades, and percentages changed since 1976?  Below is a chart to show how Field Goal Attempts Per Team and Field Goals Made Per Team have changed over time by the range categories of 0 to 19 yards, 20 to 29 yards, 30 to 39 yards, 40 to 49 yards, and 50+ yards:


As this is a little hard to see, here is each category broken out into separate graphs:

Here is what we can see about field goals:
  •  0 to 19 have decreased over time.
  • 20 to 29 have increased and decreased, but seem to have stabilized.
  • 30 to 39, 40 to 49, and 50+ have all increased.

Here is a video which shows this progression over time.  The size of each plot is the field goal percentage (mades/attempts):


You may have noticed something funny in 1982.  The number of Field Goal Attempts per team suddenly dropped, and then went back to a more normal state in 1983.  This is due to the fact that in 1982, NFL players went on strike.  Consequently, only 9 regular season games were played of the usual 16 games, and hence, there were fewer games in which field goals could take place (so fewer field goals).

1976 vs. 2014


We can see that the most dramatic change is in the 50+ category, from very few (and rarely successful) to pretty common (and moderately successful).

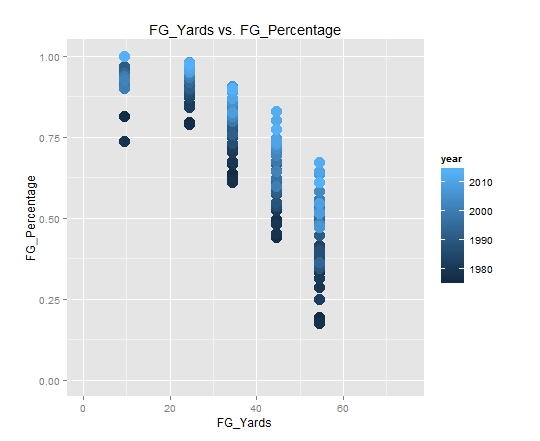
We can look at this data in a different way, plotting the yards on the x-axis and the FG percentage on the y-axis for each category (using the midpoint to estimate the category), and then plot each year to see how the percentage has changed over time for each category:


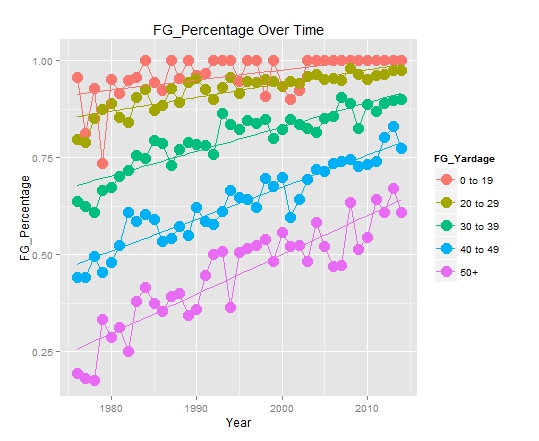
We can also look at Field Percentage Over Time, with Year on the x axis and FG_Percentage on the Y axis, broken out by the FG_Yardage:


Field goal kickers are getting much more consistent in making their field goals.  Again, the most dramatic is the 50+ category, going up from below 25% to over 60% in accuracy.  Here is a video showing the change over time:


1976 vs. 2014


In 1976, we would estimate the maximum range for a field goal kicker to be just over 60 yards:


In 2014, although a much riskier estimate (we'd need more detailed data beyond 50 yards), we could estimate the maximum range for a field goal kicker to be just under 80 yards:


What is, in fact, the longest recorded NFL field goal?  It looks like it is 64 yards by Matt Prater in 2013.  College football has seen a 69 yard field goal, and high school a 68 yard field goal.  So probably an 80 yard field goal is overly ambitious, but a 70 yard field goal is definitely possible in an NFL game.  I wouldn't be surprised to know that NFL kickers have, during practice, kicked a field goal over 70 yards.  However, since a missed field goal could mean great field position for the other team, coaches may be reluctant to try the maximum range for their kickers in actual play.


Extra Points Over Time

Extra points are being kicked more over time (probably because more touchdowns are occurring), and these are being made more frequently than in the past.  For example, in 1976, 81 of 898 XPs were missed.  In 2014, only 8 of 1230 were missed.  So an XP is now almost practically guaranteed (although with the recent rule change backing up the XP, this may no longer be the case in 2015 and beyond).


Punting Over Time

The NFL has had about 70 to 80 kickers/punters per year pretty consistently.  Except for 1987, when this shot up to 137 from 74, then back down to 77.  What happened?  Well, in 1987, there was also an NFL player strike, except this time, replacement players were used for several games.  Hence, each team had 2-3 replacement punters/kickers and 2-3 regular punters/kickers that played at some point in the season.

Punt counts have stabilized near about 2,500 per season.  A low point (ignoring 1982) occurred in 1990,  but increased to present day levels around 1997.


While average punt counts per team are about 70 per season, max punt counts per season are between 100 and 110.  In 2014, the most punts were 109 for the Raiders' punter.  This isn't surprising since the Raiders were 3-13.

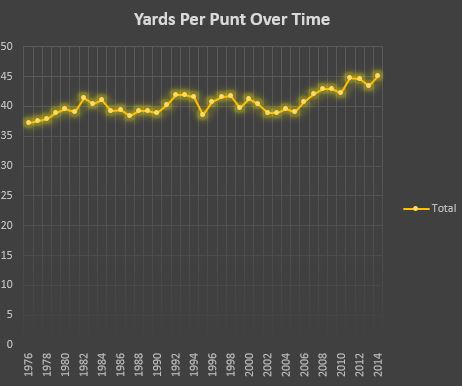
Punt yardage has been increasing over time.  Since the number of punts has somewhat stabilized, this suggests that punters are getting longer punts on average.


When we look at Yards Per Punt, the average for all teams each year has been modestly increasing over time.  So this also suggests that, in general, punters are getting better at getting longer punts.


The longest punts each season range from the upper 70s to lower 90s.  The longest punt in this timeframe is 93 yards by Shawn McCarthy of the 1991 Patriots.  The second was 91 by Randall Cunningham in 1989 for the Eagles.  Amazingly, Randall Cunningham is a QB.  He punted 6 times that season.  He also had the highest yards per punt average in 1994 of any player at 80.  Of course, he only punted once that season...

Most punters get a punt blocked once each season.  However, the most anyone gets blocked each season is generally about 3 times.  Blocked punt counts over time have been pretty erratic, but they are perhaps making a comeback, with 23 in 2014, up from 6 in 2009.


 Conclusion

I hoped you enjoyed this brief history of kicking through the eyes of statistics.   With recent rule changes and so many games being decided by a single field goal (or missed field goal), the importance of , in particular, field goal/extra point kickers is likely to only increase in coming years. That is, the quality of a kicker will likely play a huge role  in determining whether a team is successful or not.  We shall see.

-------------------------------------------------------------------------------------------------------------

Note: a friend pointed me to this article several days after I posted my article.  I did not know about this article at the time of my writing or publishing, but as it was published before mine, I'd like to give it its due credit.  The analyses are a bit different but complement my own analyses, so it's worth taking a look.