Introduction
In a previous post, I found short and long routes through all fifty USA states using simulation in R. However, I did not use R's visual and mapping capabilities to display the results. In this post, I use these capabilities and also display a "short" route through each of the world's country capitals.Visualizing the USA State Route
After trying out various mapping packages in R, I settled on using RgoogleMaps. It is easy to use and also has great maps provided by Google. Here is an automatically generated map of the shortest route I found that starts in Washington and stops in each of the 50 state capitals only once.The map is cleaner, more visually appealing, and also easier to create since I do not have to manually draw lines. This becomes especially important when increasing the number of plots and lines, as in the next scenario.
Visualizing a World Route
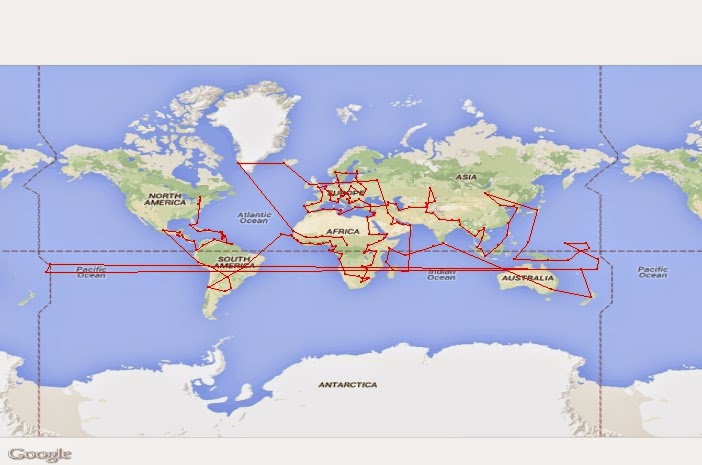
I created a list of world country capitals along with their associated latitudes and longitudes, largely using the list found here. I also added a few disputed territories, Greenland, Taiwan, and some other smaller territories to get a list of 197 stopping points in the world. My intention was not to make a political statement in including some countries and territories and excluding others. I merely want to have a set of countries which reasonably represents "all countries" of the world for the purposes of finding and displaying a route to "all countries" of the world.Using an algorithm to find a route from each country's capital to the remaining closest country's capital, I got the following route:
- Minimum Distance: 104,018 miles
- Minimum Route: United States of America, Canada, Bahamas, Cuba, Jamaica, Haiti, Dominican Republic, Saint Kitts and Nevis, Antigua and Barbuda, Dominica, Saint Lucia, Saint Vincent and the Grenadines, Grenada, Trinidad and Tobago, Barbados, Guyana, Suriname, Venezuela, Colombia, Ecuador, Panama, Costa Rica, Nicaragua, Honduras, El Salvador, Guatemala, Belize, Mexico, Peru, Bolivia, Paraguay, Uruguay, Argentina, Chile, Brazil, Cape Verde, Senegal, Gambia, Guinea-Bissau, Guinea, Sierra Leone, Liberia, Cote d'Ivoire, Ghana, Togo, Benin, Nigeria, Equatorial Guinea, Cameroon, Gabon, Sao Tome and Principe, Republic of the Congo, Democratic Republic of the Congo, Angola, Namibia, Botswana, South Africa, Swaziland, Mozambique, Lesotho, Zimbabwe, Zambia, Malawi, Tanzania, Kenya, Uganda, Rwanda, Burundi, South Sudan, Ethiopia, Djibouti, Yemen, Eritrea, Sudan, Egypt, Israel, Palestine, Jordan, Syria, Lebanon, Cyprus, Turkey, Romania, Bulgaria, Macedonia, Albania, Montenegro, Bosnia and Herzegovina, Serbia, Hungary, Slovakia, Austria, Czech Republic, Germany, Denmark, Norway, Sweden, Estonia, Finland, Latvia, Lithuania, Belarus, Ukraine, Moldova, Poland, Croatia, Slovenia, San Marino, Vatican City, Italy, Monaco, Switzerland, Liechtenstein, Luxembourg, Belgium, Netherlands, United Kingdom, France, Andorra, Spain, Portugal, Morocco, Algeria, Tunisia, Malta, Libya, Greece, Armenia, Georgia, Azerbaijan, Iran, Turkmenistan, Tajikistan, Uzbekistan, Kyrgyzstan, Kazakhstan, Afghanistan, Pakistan, India, Nepal, Bhutan, Bangladesh, Myanmar, Thailand, Laos, Viet Nam, Cambodia, Malaysia, Singapore, Indonesia, Brunei Darussalam, Philippines, Taiwan, South Korea, North Korea, China, Mongolia, Japan, Palau, Timor-Leste, Papua New Guinea, Solomon Islands, Nauru, Kiribati, Marshall Islands, Micronesia, Tuvalu, Fiji, Tonga, Samoa, Vanuatu, New Zealand, Australia, Sri Lanka, Maldives, Seychelles, Somalia, Comoros, Madagascar, Mauritius, Oman, United Arab Emirates, Qatar, Bahrain, Saudi Arabia, Kuwait, Iraq, Russia, Ireland, Iceland, Greenland, Mauritania, Mali, Burkina Faso, Niger, Chad, Central African Republic
I had originally tried to manually visualize this route by plotting and drawing lines. This was way too difficult and time consuming, so I figured there must be a better way using R. Using RgoogleMaps, I came up with the following visualization:
This worked really well except when it came to the international dateline. The plotting function interpreted the countries of Tonga and Samoa as being on the other side of the world from the other islands they are close to, because they have negative longitudes while the other islands have positive longitudes. However, they are quite close geographically, which is why they were selected by the algorithm as being next in the route. To fix this, I gave them a positive longitude by adding 360 to their actual longitude. This corrected the problem visually.
For fun, I wrote a program to show the progression of the route from stop to stop. Here is the result:
Happy travels!


No comments:
Post a Comment